
Optimization programs pay big dividends for campus utilities
By Jason Makansi, Pearl Street Inc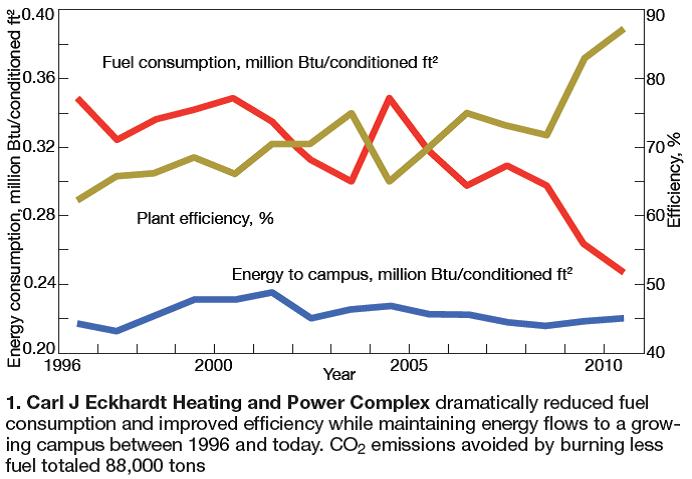
The University of Texas at Austin (UT) began a major expansion of campus utilities back in the mid-1990s. Today, the Utilities & Energy Management Dept (UEMD) provides all of the heating, cooling, and electric service for university’s 18 million ft2 of conditioned space. With 50,000 students and 20,000 staff, think of the challenge as supplying the comfort for a small city.
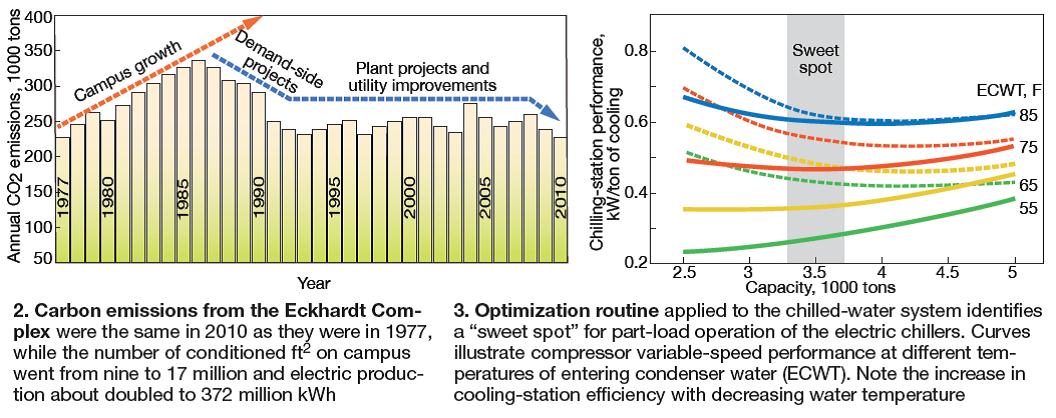
Particularly noteworthy is that laser-focused attention to energy management enabled the UEMD team to hold fuel consumption to that of 15 years ago, while the campus doubled in overall building space (Fig 1). The story on carbon emissions is even better (Fig 2). Carbon emissions today are equivalent to 1977 levels. Environmental performance is important, not only because UT is a world-renowned research institute, but also because the Carl J Eckhardt Heating & Power Complex (formerly the Hal C Weaver Power Plant) is in the middle of the campus. For its outstanding achievements in reducing fuel consumption and pollutant emissions, the Eckhardt facility has been selected to receive the CCJ’s 2012 Pacesetter Plant Award (Sidebar 1).
1. Eckhardt embraced a standard of excellence still reveredCarl J Eckhardt Jr, for whom the UT Austin Heating & Power Complex is named, would have been proud of the accomplishments of Utilities & Energy Management Dept Executive Director Juan Ontiveros and his staff, as described in the main article. Eckhardt is a UT icon. With two engineering degrees from the university and a faculty post, he accepted responsibility in 1931 for what was known then as the UT Physical Plant. Born Oct 28, 1902 in Yorktown, Tex, Eckhardt earned a bachelor of science in mechanical engineering degree in 1925 and his master’s in 1930. He taught mechanical engineering at the university from 1926 until his retirement in 1973. Eckhardt also is regarded an expert on UT history, having written six books on the subject. He remained an active supporter of the institution until his death Jun 29, 1995. Among his many papers on file in Austin is a report, “Specifications for a complete steam generating system: Main Power Plant, University of Texas.” Like Ontiveros and his team, Eckhardt was respected for his many achievements in the powerplant as well as for the reassembly of famed Santa Rita No. 1 oil rig on the Austin campus. The rig, the first to “blow in” on university-owned property in West Texas, ultimately produced more than $300 million in revenues for the Permanent University Fund. |
 “Key to the efficiency improvement,” says UEMD Executive Director Juan Ontiveros, “is an optimization program that we implemented to achieve the lowest electric consumption per ton of chilled water, coupled with a real-time hydraulic model of the chilled-water distribution system. The results from this effort identified a straightforward operational strategy,” he says. “Run the gas turbine/generators flat out but match them to actual campus demand and pair the HRSG steam output with the steam turbines, swing the fired boilers to meet load changes, and optimize the chilled-water system.” Cooling consumes from 30% to 50% of the plant’s total load energy requirement.
The plant enlisted Optimum Energy LLC, Seattle, to operate the chilling stations using OptimumLOOP™. This software platform enables real-time monitoring of chiller-plant equipment and calculates the most efficient sequencing of that equipment based on real-time building loads, without compromising on occupant comfort or process cooling requirements.
Important to the success of OptimumLOOP is feedback provided by Termis hydraulic modeling software supplied by 7-Technologies A/S, Birkerod, Denmark, now owned by Schneider Electric. “Termis gives us a visual look into what is happening to the real-time flows in the loops,” says Ontiveros. The model takes as inputs weather conditions, real-time building energy flows, plant chilled-water flow, and differential-pressure (DP) readings from critical points in the system to predict and validate conditions throughout the network—including flow-constraint locations.
Fifteen new DP sensors were added to give the system a more complete data set. This is valuable information if you have multiple chiller plants that can be dispatched on a common loop. “Now we can strategically analyze process conditions when different equipment (for example, chillers) is dispatched,” notes Ontiveros.
The basic goal of system optimization is to use the least amount of electricity to produce a ton of chilled water by doing the following:
-
- Running at the lowest DP possible to minimize cooling-water pumping horsepower.
- Simultaneously resetting chilled-water supply temperature when conditions allow.
- Operating the pumps and chillers optimally by controlling the speeds of the motors to meet actual load needs. This goes hand in hand with optimally dispatching the other constant-speed equipment in the other stations to achieve the lowest number of kilowatts per ton of cooling.
A critical goal was to operate the system more efficiently at part load because the campus is at peak conditions only about 20% of the annual operating hours, which is typical of most cooling systems (Sidebar 2).
Intelligence + VFDs
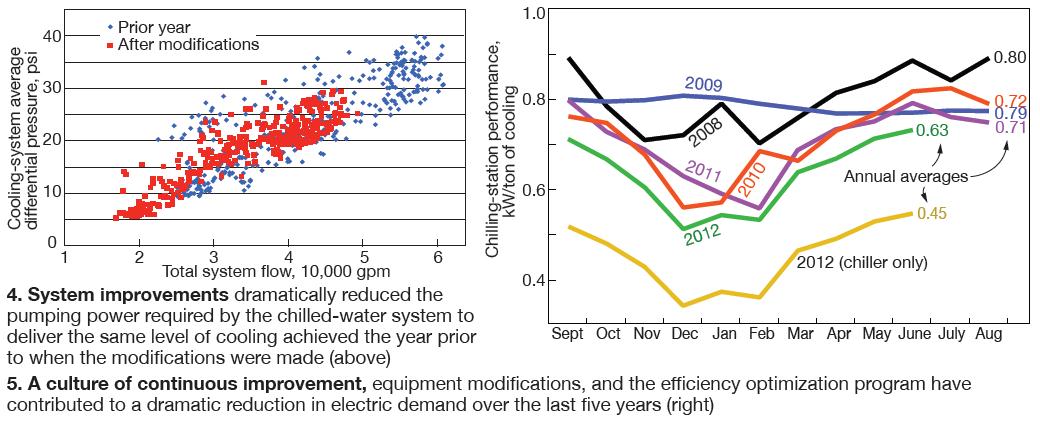
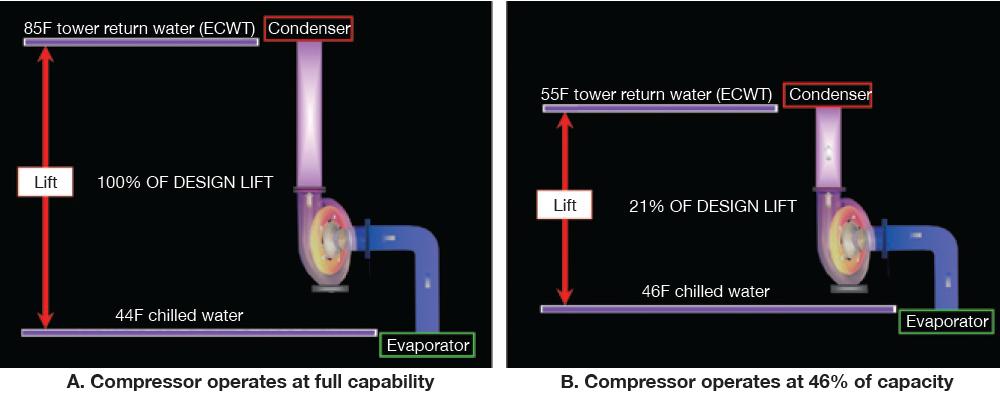
The added intelligence offered by the optimization software would have had little benefit without critical hardware upgrades. The plant now has variable-frequency drives (VFD) on the chillers, condenser cooling-water pumps, cooling-tower fans, and chilled-water supply pumps in the newest chilling station. In a nutshell, the optimization routine identifies a “sweet spot” (Fig 3) for chillers to operate under part-load conditions and simultaneously does the same for the cooling-tower fans and pumps to optimize condenser water temperature. Plus, it regulates the chilled-water pumps to deliver the water with the least amount of horsepower, using loop pressure data (Fig 4).
Bottom line is that optimization has reduced energy consumption by 28% to 30%. One of the unanticipated benefits was that the chilled-water system now runs at a higher overall delta T because buildings are no longer overcooled by over-pressurization of the distribution loop. This lowered peak chilled-water flow, and also reduced chemical treatment costs in the chilled-water supply system and cooling tower, because less heat must be rejected.
A reduction in building steam use was another bonus of the program because the correct amount of chilled water was delivered to buildings, thereby preventing overcooling. It’s clear that optimization has provided dramatic value system-wide (Fig 5).
Referring to the illustration, each point on the curves is the monthly average power consumption to produce a ton of cooling, which is the best measure of chilling-station efficiency. The top five curves give the total power requirement—chiller compressors, cooling-tower and chilled-water pumps, and fans; the lowest curve gives chiller-only performance for 2012.
The 2010 and 2011 numbers reflect first use and the positive impact of the OptimumLOOP performance enhancement software. The 2012 numbers reflect the performance gain from lowering the chilled-water distribution pressure, which reduced pumping power requirements. Plant personnel took this step after data analysis revealed instances where more kilowatts per ton were being consumed by the cooling towers and pumps than by the chillers. The benefit was larger than expected.
Capital investment in the program included $200,000 to implement the optimization software and $400,000 for each of the chiller VFDs, plus the pumps and tower fans. Two side notes regarding the VFDs: They must be housed in cool ventilated areas, which slightly penalizes parasitic load; also, you must pay close attention to avoiding harmonics—such as from the cooling-tower fans. Ontiveros describes the new 15,000-ton chilling station, using Johnson Controls Inc’s York OM chillers paired with Toshiba VFDs, as “the most efficient in the US.”
“We paid for the Termis software during the calibration process,” claims Ontiveros, “when three inadvertently closed chilled-water loop isolation valves impairing system efficiency were identified using the model. In addition, we have already paid for all of the chilling station VFDs using OptimumLOOP.” He went on: “Last summer was the hottest on record, and we still saved around $900,000 in energy cost.”
2. How to reduce energy consumption in district cooling systemsA constant-speed chiller with control valves cannot offer the part-load efficiencies necessary for minimizing the electrical demand of district cooling systems. This is where variable-speed drives (VSDs) come into play. Their use on chiller compressors, cooling-tower fans, condenser cooling-water pumps, and chilled-water pumps eliminates throttling and other losses associated with constant-speed motors, with the benefit of reducing energy consumption by more than 25% in large cooling systems—such as the one serving the University of Texas at Austin. Most readers of the CCJ design, build, operate, and/ or maintain large electric generating plants typically equipped with single- or two-speed motor drives on pumps and fans. The bottom-line benefit of using variable-speed drives in large combined cycles, particularly in these days of inexpensive gas, is relatively insignificant and power engineers focus on other aspects of plant O&M to improve profitability. If you have never been affiliated with a combined heat and power (CHP) plant, the refresher below might help you better understand the challenges facing colleagues responsible for the economical operation of district heating and cooling systems and why they embrace VSDs. Power versus speed. Reducing the speed of a compressor, fan, and/or pump is a great way to save energy, provided the lower speed is consistent with the output required by the cooling system to deliver the level of comfort expected. You may recall the pertinent equation below: Power2/Power1 = (Speed2/Speed1)3. This means that if a compressor with a full-load rating of 1600 hp at 4000 rpm can deliver the output required at 2000 rpm, the power used to run the compressor drops by a factor of eight to 200 hp. Throttling to reduce load obviously makes little sense if a significant amount of operating time is at part load. The term “lift” used in connection with cooling systems is synonymous with the term “head” used in powerplants. Both are the pressure differential that a compressor, fan, or pump must develop to serve load. The greater the lift, the more power required to pump or compress a liquid or gas. To understand what a high lift requirement means in common physical terms, think of a car having to travel up a hill. Its engine must operate at higher rpms than on level ground to maintain the same speed. Likewise, a compressor’s impeller must rotate faster to deliver a given amount of refrigerant at higher lift (pressure). The penalty in each case is higher energy consumption—gasoline for the car, electricity for the compressor. Lift varies as the square of the speed, as the following equation states: DP2 (differential pressure)/DP1 = (Speed2/Speed1)2. Thus, if the rated lift of a compressor is 80 psi at 4000 rpm, halving compressor speed will reduce lift by a factor of four to 20 psi. One of the challenges of operating a cooling system like UT’s, which is six miles long, is to minimize electric consumption while assuring sufficient lift to satisfy cooling expectations at the far reaches of the network. Impact of water temperatures. The refrigerant compressor, the largest power consumer in the chilled-water plant, offers significant financial inducement for properly managing lift. Important to note is that a compressor’s lift requirement depends on the temperature differential between the water leaving the chiller and the tower return water—referred to as the entering condenser water temperature (ECWT) by CHP personnel. Compressor lift can be managed by controlling either or both of these temperatures. The lift developed by the compressor at full design capability is illustrated in Fig A. Fig B depicts compressor operation at 46% of design speed, equivalent to a power draw of only 9.7% of the full-load value. Allowing the entering condenser water to fall to 55F and increasing the leaving chilled water by 2 deg F to 46F reduces lift to 21% of the design value.
|
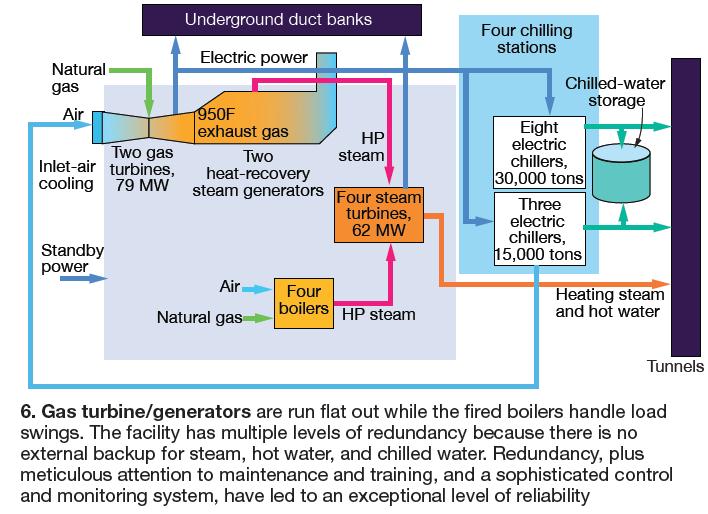
From fired boilers to GT
Utilities service started at UT in 1929 with a pair of 1.5-MW turbine/generators fed steam from lignite-fired boilers. Today, the system (Fig 6) includes the following:
-
- A 1980s-vintage 45-MW gas turbine/generator and a 32.5-MW GT installed in 2009, each with chilled-water inlet air cooling and coupled to its own supplementary-fired heat-recovery steam generator (HRSG).
- Four gas-fired boilers commissioned between 1945 and 1968 with a total capability of 800,000 lb/hr. The HRSGs and conventional fired boilers supply steam to a 420-psig header.
- Four steam turbine/generators, totaling 62 MW, that operate on steam from the 420-psig header. All steamers have a condenser; three also have a 165-psig extraction system. When a turbine is in service, a small amount of steam must flow to the condenser.
- Three new chillers totaling 15,000 tons of capacity and eight older electric chillers totaling 30,000 tons, divided among four chilling stations. The chillers are supported by 39,000 ton-hours of chilled-water storage at 12-deg-F delta T, with a peak capability of 6500 tons. The 4-million-gal tank was installed two years ago.
Thermal energy (chilled water and steam) is distributed to the campus via a six-mile tunnel system, electricity via underground duct banks. The plant contracts with Austin Energy, the local utility, for 25 MW of standby power, but the campus is on its own when it comes to steam and chilled water. Even so, reliability is calculated at 99.9998% over the last 40 years.
 The exceptional reliability results from various factors: Multiple options for prime equipment and related support equipment, a thoughtful and methodical approach to maintenance using both preventive and predictive methods, a campus-specific test-based training and certification program for personnel, and a carefully conceived digital control system that monitors, operates, and dispatches the entire energy system.
The control system is comprised of multiple proprietary systems: Siemens AG (PCS 7) and Emerson Process Management Power & Water Solutions (Ovation) for balancing thermal energy production and electric generation, and GE Proficy supervisory control and data acquisition (SCADA) system for power distribution (see second section below for details). All are tied together using Allen Bradley programmable logic controls (PLC) displayed through RSView®32™ (human machine interface) and linked to a GE Proficy historian. Simply put, a holistic solution.
The control and monitoring system seamlessly handles electrical generator upsets using the 100-MVA substation connected to the Austin Energy system though a ring of four 50-MVA transformers to import back-up power as needed. Steam for campus heating and hot-water production normally is provided by the extraction turbines. Alternatively, two redundant pressure-reducing stations operating on HP steam from the HRSGs and/or gas-fired boilers can satisfy thermal requirements.
Key to managing energy-system performance is LightRidge Resources LLC’s (Houston) PE-Advisor™, a real time thermal model of the entire system that allows for continuous monitoring of predicted conditions against actual conditions. This system helps identify equipment and instrumentation problems when operating data stray from the predicted data. In essence, PE-Advisor allows the campus energy system to be managed in real time.
System control and monitoring evolved from a totally manual, pneumatically operated plant in 1996 to the highly integrated digitally controlled system employed today. Ontiveros said, “There was no way to manage the growth, efficiency, and reliability expected of us without being brave and transforming the system while serving loads without interrupting campus utilities.”
UEMD staff stretched campus generating capability from 85 MW to the current 137 MW by doing the following:
-
- Uprating the 1988 W251–B10 gas turbine from 36 to 45 MW. Cost: $10,000. Lesson learned: Question everything and focus continually on making improvements. Turns out that years back in this GT/HRSG unit’s history someone solved an HRSG economizer flashing problem by dialing back the GT to 36 MW—less heat, no flashing. A relatively simple fix to HRSG circuitry enabled operation of the GT at rated load without flashing.
- Installing a new 25-MW steam turbine/generator from Siemens Demag Delaval Turbomachinery Inc.
- Replacing a 1965-vintage W191 gas turbine and companion HRSG with a GE LM2500+G4 DLE engine and new HRSG. Details in second section of this article.
- Installing inlet-air chiller coils on both GTs and replacing a critical cooling tower.
Ontiveros said, “This project gave me a lot of grey hair: I had to be a salesman, integrator, and crystal- ball reader to predict future loads so that new equipment could be right-sized. If that wasn’t enough, my staff and I had to commission everything to perform as expected.”
Nimble FD fans
Additional flexibility and efficiency were built into the old gas-fired boilers as well. Nos. 3 and 7, the most frequently used units, were retrofitted with Benz Air Engineering’s proprietary Compu-NOx® system that uses VFDs on the forced-draft fan motors. A new flue-gas recirculation fan with VFD was added as well. In effect, this allows the fans to be controlled as one unit so combustion-air and flue-gas flows are precisely maintained against fuel flow, NOx emissions, and excess O2.
As a result of the VFD additions, the two boilers can safely operate between nearly zero steam production and full capability , which helps immensely with a “swing” unit. Combustion-system enhancements also improved boiler efficiency by 5% to 10%, reduced NOx emissions by 91% when firing natural gas (42% when burning liquid fuel), and enable the boilers to run on 100% liquid fuel if necessary. The VFDs also allow the plant to eliminate the use of dampers for air flow control, improve FGR operation, and reduce noise levels in and around the plant.
New cogen unit greatly improves heat rate
The university’s new cogen unit, installed in late 2009 and consisting of an LM2500+G4 DLE gas turbine from GE Energy coupled to an HRSG designed and built by Express Integrated Technologies LLC, Tulsa, dramatically improved the heat rate of the Eckhardt Power Complex. The W191 engine, which was demolished along with the HRSG serving it to make room for the new equipment, had a heat rate in the neighborhood of 17,000 Btu/kWh; heat rate of the G4 is about half that. The owner’s engineer on the project was Jacobs Energy & Power Solutions.
The new gas turbine is the fourth generation of the LM2500 family and 17% more powerful than the third generation LM2500+. Power was increased by boosting air flow by 6%, raising the exhaust-gas temperature, and increasing the pressure ratio to 24.2:1 from 23.6. Design changes made to the LM2500+ to achieve the G4 performance were relatively minor.
Examples: Small adjustments to blade and stationary vanes accommodated the increase in compressor mass flow, mi n o r changes to airfoils improved blade cooling in the HP turbine, and implementation of material upgrades based on the latest aircraft experience protected hot-gas-path components, etc. Structurally, all frames—front, compressor rear, turbine mid, and turbine rear—remain unchanged, as do compressor front and aft cases, sump hardware, and the number of main bearings. A design upgrade associated with heat shields for the DLE combustor enable field replacement and a reduction in the maintenance-cycle time.
The G4, which operates about seven months annually at UT Austin, is “right-sized” for the campus at 32.5 MW. During the four coldest months, the new machine saves the university about $1 million per month. UT’s relatively low wintertime electric requirement is not a good “fit” for the generating facility’s 45-MW W251. Jacobs developed and ran models and optimization programs to assure that the new turbine and its HRSG would satisfy campus electrical and thermal requirements as intended.
The engine has performed well, Ontiveros told the editors, especially considering it was the world’s first G4 for 60-Hz electric service. The hiccups experienced in the early going primarily were associated with malfunctioning control relays—$25 items loosely speaking—that caused turbine trips. Plant staff worked closely with the OEM, Ontiveros said, to quickly resolve issues.
 HRSG installation challenge
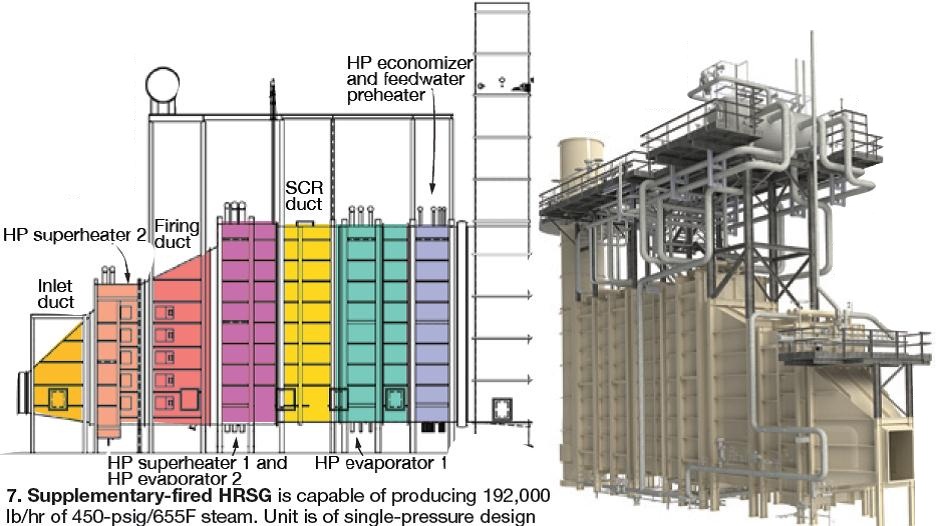
The single-pressure HRSG, duct-burner equipped, produces up to 192,000 lb/hr of 450-psig/655F steam (Fig 7). Its feedwater preheater section is equipped with duplex stainless steel tubes to prevent cold-end corrosion. The SCR relies on a urea hydrolysis system from Fuel Tech Inc to produce, on demand, the ammonia reagent required for controlling NOx to the 5 ppm required. Ontiveros did not want an ammonia storage tank in the middle of the campus. Recall that urea is non-toxic.
Ontiveros said the basis for HRSG selection was life-cycle cost. The university wanted a well-made boiler that provided “value.” The only issue with the boiler to date concerned ammonium sulfate fouling and corrosion of the condensate heater tube fins and has nothing to do with the unit’s design. The chemicals were carried along with cooling-tower drift into the compressor. An effective solution involved operating the tower differently and reducing its duty.
The big challenge with respect to the HRSG was shoehorning it and the G4 into the building that was once home to the W191-powered cogen unit, and meeting a tight installation schedule. The new boiler was designed to install it in the available space with virtually no changes to the building structure. UT Austin, the editors were told, views the preservation of its buildings and the large oak trees that line the street in front of the Eckhardt Complex very seriously.
The schedule required that all of the major duct and heat-transfer modules be installed in one week over the 2009 spring break. A complication arose when design engineers realized that the door to the building could not accommodate the boiler modules—nominally 42 ft tall × 13 ft wide and the largest more than 11 ft in the direction of gas flow—without removing their legs and that the steam drum and mezzanine platform would have to be located above the roof line. Weight was another consideration: The heaviest module was 75 tons.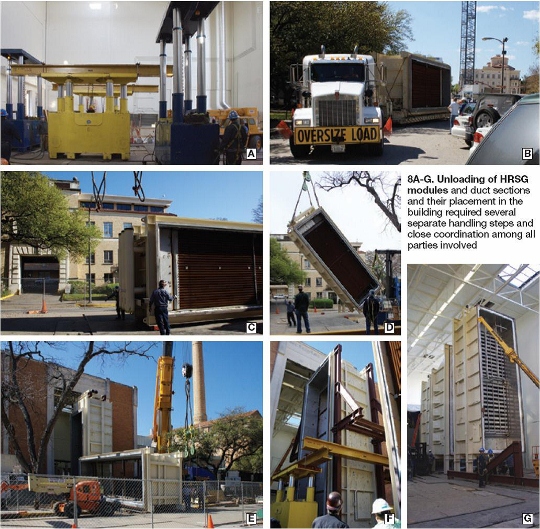
During the design phase, Express personnel worked closely with the owner, Jacobs Energy & Power, and the installation contractor to develop a method for moving the modules into the building using a system of three gantry-type hydraulic lifting devices (Fig 8A). The first set lifted the modules off the truck (B) and set them on four skates (C) so a forklift could move them into position for lifting by the crane (D).
The crane lifted each module in turn upright and swung it into position at the entrance to the building (E), where a set of lifting frames was attached, enabling the second gantry system to lift the module and bring it into the building (F). Once inside, the module was transferred to a third gantry system which moved at a right angle to the second. The third gantry moved the module into position with the modules already installed. Legs were then attached and the module snugged up to the HRSG train (G).
While all of this was going on inside the building, logistics personnel were working with the trucking company and the university to choreograph the next load into place.
Powerplant controls
A major control system upgrade, implemented for the campus energy-supply systems in spring 2008, assures a high degree of operational reliability in the production and distribution of electrical and thermal energy. The state-of-the-art energy control and energy management system (ECEMS) accomplishes the following:
-
- Monitoring of power flows via the electrical tie to Austin Energy.
- Demand control.
- High-speed contingency analysis and load shedding.
- Control of reactive power.
The four tie lines connecting the university to Austin Energy are rated 69-kV. Voltage is transformed to 12 kV for campus use. Both gas turbines and two of the steam turbines produce power at 12 kV; the other two steamers generate at 4.16 kV and are dedicated to serving several old buildings.
Load on the distribution system varies during the day, as you would expect. It is maximum in the late afternoon/early evening, minimum at night. The ECEMS monitors and manages voltage, protecting the system during transients that conceivably could be problematic—such as an overvoltage condition at minimum load.
Distribution-system control is accomplished via a SCADA system running on redundant servers that communicates with external instrumentation and control devices. Communication is via two fiber rings, Ethernet, and OPC (open process control) links (OLE, object linking and embedding, is used for process control).
The SCADA program has a database that tells the software about the connected instrumentation and which parameters within the instruments to access. The database also may retain information on how often the parameters are accessed and if a given parameter is read-only or read/write, allowing the operator to change a value.
Demand control is the ECEMS function of greatest interest to most readers. In the Eckhardt Power Complex it controls the loads on the available gas and steam turbine/generators such that the amount of power purchased from the utility is equal to the desired amount of purchased power entered by the operator. The logic technically enables the operations team to buy power when it is less costly than producing it onsite and to sell electricity to Austin Energy when that works for both parties. However, the system always has operated in self-generation mode because dispatching to or taking from the Ercot grid is considered higher risk than self-generation.
The following steps outline the sequence in which loads are controlled on the steam and gas turbine/generators with all prime movers in service:
-
- Allow the GTs to reach their maximum load while operating the STs based on current process steam demand and minimum condenser flow.
- When the GTs are at maximum load, increase outputs from the STs until nameplate ratings are reached or the available amount of 420-psig header steam is exhausted.
- If the plant’s internal generation is at max, and power demand continues to rise, satisfy the additional demand with steam produced by the fired boilers.
- If university power demand rises above that capable of being served by both internal and external sources, automatic load shedding can reduce load. Alternatively, the operator can decide on which loads to shed. CCJ