
Take control of your SCR catalyst management
By L Muzio and R Smith, Fossil Energy Research Corp, and J Baker and J Perez, Riverside Public Utilities
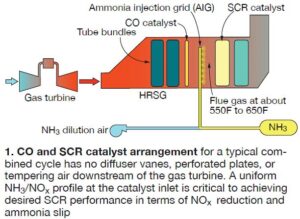 Combined- and simple-cycle gas turbine (GT) systems typically rely on oxidation and SCR catalysts to reduce CO and NOx emissions, respectively. In a combined cycle, GT exhaust gas usually flows through one or more HRSG tube banks before entering the CO catalyst (Fig 1). Ammonia, a reagent, is injected downstream of the CO catalyst and ahead of the SCR catalyst, where it combines with oxides of nitrogen in the exhaust gas to form nitrogen and water vapor.
An important O&M activity is management of the CO and SCR catalysts. Theoretically, a catalyst does not wear out with use; rather, it just helps a reaction take place. However, contaminants in the exhaust gas poison the catalysts over time and reduce their effectiveness. Catalyst management involves systematically tracking catalyst performance both to (1) ensure continued environmental compliance, and (2) provide timely information to guide catalyst purchases and replacements.
This article discusses how CO and SCR catalysts should be managed and how you as an owner/operator can take control of the management process by performing tests within the unit.
SCR catalyst management
Catalyst management for a combined-cycle SCR system entails tracking key parameters so you know when the catalyst must be changed. These parameters are catalyst activity (K, m/hr) and reactor potential (RP, dimensionless). The first determines how well a catalyst is performing regarding NOx reduction. While deactivation is less severe in a combined-cycle SCR than it is in a coal-fired unit, it still occurs.
Typical poisons in a combined-cycle SCR include sodium and phosphorous. The former may enter the gas stream from (1) water injected into the engine for NOx control or power boost, (2) off-spec water used in the production of aqueous ammonia, and (3) ambient sources for units located near the coastline. Phosphorous comes from lube oil that finds its way into the GT exhaust stream.
In an SCR reactor, if excess ammonia is present—that is, NH3/NOx > 1—NOx reduction is calculated using the following equation:
ΔNOx = (1 – e–K/Av)
where Av is the area velocity (exhaust-gas flow rate divided by the total amount of SCR catalyst area):
Av = Q ÷ VcatAs
Note that Equation 1 is used to measure SCR catalyst activity in a laboratory.
In conducting a laboratory activity test on SCR catalyst, a specified volume of catalyst is exposed to a known gas flow rate. The gas can be actual GT exhaust gas, or simulated gas at a given temperature and inlet NOx level. Ammonia then is injected at the sample inlet at a high NH3/NOx ratio to provide excess ammonia at the catalyst surface.
Depending on the laboratory, the ammonia injection rate may be NH3/NOx = 1.0, 1.2, or 1.5. NOx reduction is measured across the catalyst sample and the activity, K, is determined from a rearrangement of Equation 1 based on the maximum NOx reduction measurement and gas velocity through the catalyst. It is presented this way:
K = –Av ln(1 – ΔNOx)
While the foregoing laboratory process seems simple, it’s not quite so. For instance, what conditions should one use to determine the activity in the laboratory (gas composition, temperature, area velocity, etc) and how should the results be reported? There are established testing protocols for coal SCR catalyst—such as the European VGB guidelines and EPRI’s SCR catalyst testing protocol—but none for GT SCR catalyst.
To illustrate: Table 1 summarizes conditions used by five GT catalyst testing laboratories and how the results are reported. Note that there is no consistency in the test conditions used. There are variations in the Av used for the test, the temperature, and the NH3/NOx ratio used for determining the activity, K.

How the results are reported also varies. Laboratories C, D, and E either report the actual activity K, or provide sufficient data to calculate K. Laboratory A reports a relative activity (either K/Knew, or K/Kmin). Laboratory B differs too, reporting the level of NOx reduction that the catalyst achieves at the ammonia slip limit.
This lack of an established testing protocol can make catalyst management difficult. If an owner/operator decides to change laboratories, can the data from the old and new laboratory be used together? For instance, if you have a history of just the relative activity, K/Knew, then switch to a laboratory that reports K, how can these data sets be merged since the original laboratory did not report Knew?
Reactor potential. Although catalyst activity is important, the key parameter for determining SCR performance is the reactor potential, RP—basically, the activity multiplied by the total catalyst surface area per unit of exhaust gas. Given an initial NOx level, required level of NOx reduction, and limit on NH3 slip, one can calculate the minimum RP that a reactor needs to achieve this given performance goal. This is expressed mathematically as:
RPmin = K ÷ Av = f(NOx-inlet, ΔNOx, and NH3 slip)
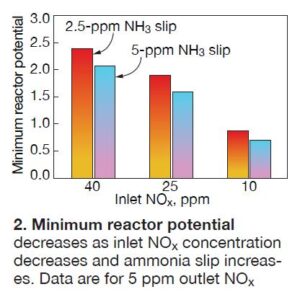 Fig 2 shows how the minimum RP varies for two levels of required NH3 slip and varying inlet NOx, assuming an outlet NOx level of 5 ppm must be achieved. RP is important because it reflects the effects of both catalyst activity and area velocity. Several factors can influence area velocity calculations. For example, insulation accumulation on the catalyst surface will reduce the available catalyst surface area and, consequently, RP.
Variations in GT exhaust-gas flow also can increase or decrease RP. Thus, from an overall operating perspective, the RP determines SCR performance—not just catalyst activity. Ultimately, SCR catalyst management entails (1) knowing the minimum RP needed to achieve the necessary performance, and (2) monitoring the RP over time. Other factors, such as the NH3/NOx distribution entering the catalyst are also important. Access background material via this link: SCR PERFORMANCE MANAGEMENT: AIG tuning, catalyst for life forecasting.
Measure RP in-situ. While sending samples to a laboratory for activity measurements historically has been a key step in catalyst management, it is no longer necessary. As mentioned earlier, there are numerous shortcomings associated with laboratory analysis. Today, an owner/operator can take control of catalyst management with CatalysTraK®, a system that measures catalyst activity and RP in-situ.
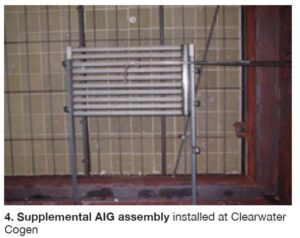
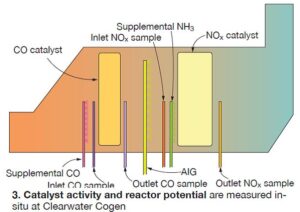 Fig 3 provides an overview of the CatalysTraK approach for gas-fired turbine applications. Similar to the laboratory approach for SCR catalyst, NOx reduction is measured across a small cross section (“test section”) of the catalyst bed. A small supplemental ammonia injection grid (AIG) is permanently mounted upstream of the test section (Fig 4).
Additionally, an inlet gas sampling probe is installed directly upstream of the AIG, and an outlet gas sampling probe is installed immediately downstream of the catalyst bed at the test section. The supplemental AIG is used to increase the NH3/NOx level and provide excess ammonia across the catalyst test section. The RP calculation then is based on the maximum NOx reduction measured across this catalyst test section.
CatalysTraK was developed for coal-fired SCRs. These systems are characterized by multiple catalyst layers, where the total RP is the sum of the reactor potentials of the individual layers. With the lower RP of the individual layers, it is relatively easy to make an RP measurement across a catalyst layer.
One issue related to the application of CatalysTraK to a GT SCR is that these systems have a single layer of catalyst and it contains all of the reactor’s RP. Thus, when catalyst is relatively new, the measured NOx reduction across a layer of GT catalyst at NH3/NOx > 1 can be greater than 99%.
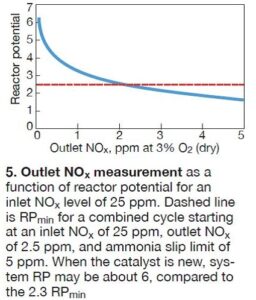
 This can make difficult to accurately determine the RP. For instance, with an inlet NOx level of 25 ppm, Fig 5 shows the expected measurement of the outlet NOx as a function of the RP. The dashed line in the illustration is RPmin (2.3) for a combined cycle starting at an inlet NOx of 25 ppm with an outlet NOx of 2.5 ppm and an ammonia slip limit of 5 ppm.
When the catalyst is new, the RP for the system may be about 6, significantly higher than the 2.3 minimum. For the “new” condition, the outlet NOx measured with the CatalysTraK system can be less than 0.2 ppm. However, Fig 5 shows that as the catalyst ages and RPmin is approached, the CatalysTraK measurement will exceed 2 ppm—a level that is easily measured. The bottom line: Early in a catalyst’s life, the CatalysTraK measurement may have a higher degree of uncertainty associated with RP, but at that point in a catalyst’s lifecycle it is not critical that the RP be precise.
As the catalyst ages, the shape of the deactivation curve becomes better defined. In fact, one of the advantages of CatalysTraK is that a larger data set can be acquired, particularly towards end-of-life when performance changes—as evidenced by increasing NH3 slip—occur more rapidly.
Field validation. CatalysTraK SCR tests recently were conducted at the Clearwater Cogeneration Plant, owned and operated by the City of Riverside (Calif) Public Utilities. Two sets of measurements were taken as shown in Table 2. For Test 1 the inlet NOx was a little lower than for Test 2 (23.9 versus 25.6 ppmc). Supplemental NH3 was injected until the outlet NOx leveled out at 0.183 ppmc and 0.235 ppmc for Tests 1 and 2, respectively. These latter levels then were used to calculate the RP values of 4.9 and 4.7.

 The average measured RP of 4.8 is substantially higher than the 2.3 minimum RP value. While there can be some uncertainty in the absolute level of the RP because the outlet NOx during the measurement was low (about 0.2 ppm), the SCR catalyst is clearly very active. However, as was shown in Fig 5, the outlet NOx with the supplemental NH3 injection will increase to more than 2 ppm as end-of-life approaches.
Since the as-installed catalyst RP was unknown, the remaining catalyst life was estimated by assuming a fairly aggressive deactivation rate of 5% per 10,000 hours of operation. Also, as mentioned previously, the minimum RP = 2.3 assumes a good NH3/NOx distribution entering the catalyst.
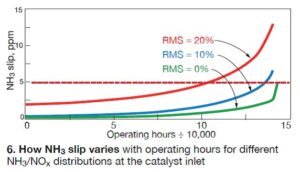
Typically a good NH3/NOx distribution for a gas turbine SCR system would be characterized by an RMS < 10%. When the Clearwater Cogeneration AIG was recently tuned, the RMS was about 20%. Fig 6 shows how ammonia slip varies with operating hours (zero being when the CatalysTraK measurements were made) for different NH3/NOx distributions entering the catalyst. The distributions assume 90% NOx reduction from an inlet NOx level of 25 ppm). Specifically:
• RMS = 0%: At 143,000 hours, RP reaches the minimum of 2.3. Here, the NH3 slip increases to the 5-ppm limit. Beyond this point there is insufficient activity to reach 2.5 ppm of NOx.
• RMS = 20%: Slip of 5 ppm is reached at 100,000 hours of operation (RP = 2.3). This NH3/NOx maldistribution significantly reduces catalyst life.
While the catalyst management can be performed just using the reactor potential, RP, it is of interest to also look at the catalyst activity, K, based on the in-situ results. The area velocity for these tests was calculated to be 13.9. The in-situ measurements, along with the calculated Av, yield a catalyst activity of 66.5 m/hr (K = RP x Av).
There is some uncertainty in the absolute activity because the slope of RP versus the outlet NOx level is quite steep at such high-activity values (refer back to Fig 5). Thus, if the measured outlet NOx concentration is off by ±0.1 ppm, the calculated activity can range from 62.3 to 76.5. The precision increases as the catalyst ages. But the fact remains that CatalysTraK is able to characterize the state of the SCR catalyst using some fairly simple in-situ measurements.
 CO catalyst testing
As with SCR catalyst, CO catalyst performance also degrades over time. Historically, samples are taken from the CO catalyst bed (either specifically designed test samples, or core-drilled samples from the actual bed). In the laboratory they are typically tested at the same space velocity (exhaust gas flow rate divided by CO catalyst volume). The test involves just measuring the amount of CO oxidation that occurs across the sample.
Why use a laboratory to make this measurement? Why not just measure the oxidation across the actual CO catalyst bed while it is operating? This also was done during the recent Clearwater Cogeneration tests. An inlet and outlet probe pair was located across a local region of the CO catalyst and the amount of CO oxidation was measured.
Four sets of CO measurements were made across the catalyst. These results, presented in Table 3, show the oxidation of CO across the CO catalyst at the test location was quite high, averaging 96.7%.

Wrap up. Historically, laboratory tests have been used to monitor the performance of both SCR and CO catalysts over time. The lack of a testing protocol, particularly for gas-turbine SCR catalyst layers, causes problems with inter-laboratory comparisons. Recent tests at the Clearwater Cogeneration Plant showed both SCR and CO catalysts can easily be characterized in-situ. The in-situ technique is simple. It can be done easily during an annual compliance test, does not require an outage, and provides an opportunity to obtain a more comprehensive data set. CCJ