


St. Charles Energy Center
Owned by CPV Maryland LLC
Operated by Consolidated Asset Management Services745 MW, 2 × 1 7F.05-powered combined cycle equipped with a GE D11A steam turbine, located in Waldorf, Md
Plant manager: Nick Bohl
RO clean-in-place wastewater discharge mod reduces manhours, cost
Background. St. Charles Energy Center uses two double-pass reverse-osmosis (RO) systems with electrodeionization (EDI) skids to produce demineralized water for the plant’s heat-recovery steam generators. The RO system contains a clean-in-place (CIP) feature for removing accumulated impurities to restore performance and efficiency.
The as-built plant design used a trough located in the water-treatment building to route the CIP wastewater to the plant wastewater collection sump (WCS), which discharges the CIP wastewater back to the local water treatment facility (WTF) for processing and reuse.
St. Charles’s wastewater discharge permit specifies that the pH for this water must be greater than 5 and less than 10 when discharging back to the local WTF. During a CIP, wastewater pH can range from less than 4 to more than 11. Sending water with a pH in this range to the WCS during a CIP increases the chance of permit non-compliance.
Challenge. To prevent a permit violation attributed to low or high pH, the plant would increase cooling-tower blowdown to the WCS to dilute the sump water, or use chemicals—such as sodium hydroxide or hydrochloric acid—to neutralize the wastewater in the CIP tank before discharging it to the WCS.
Both methods were inefficient, costly, and introduced a great risk of human error. Blowing down the cooling tower to dilute the sump contents uses water in the tower that must be made up to maintain proper operational level, while at the same time increasing wastewater costs because of the increase in discharge to the WTF. Plus, there is a safety risk associated with the storage and handling of sodium hydroxide and/or hydrochloric acid to neutralize sump contents.
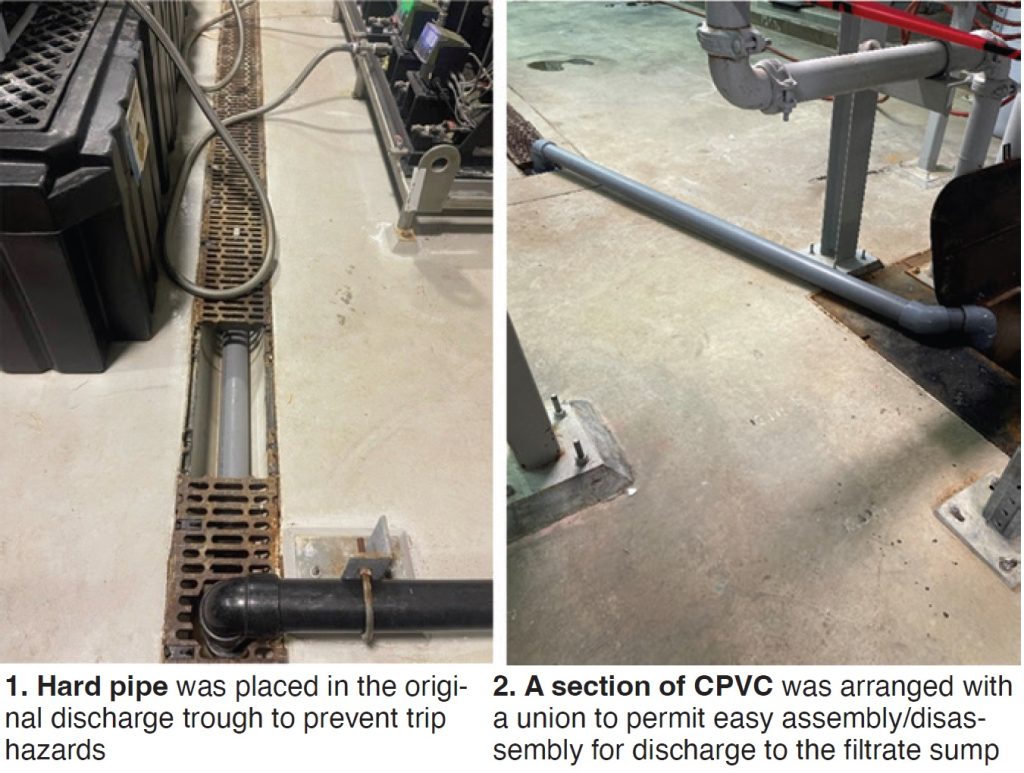
Solution. The plant addressed these issues by hard-piping the CIP tank discharge line to the filtrate sump, thereby allowing its contents to be pumped out directly into the cooling-tower basin instead of the WCS. The new hard pipe was placed in the original discharge trough to prevent trip hazards (Fig 1). The team also manufactured a section of CPVC with a union so the piping can be assembled and disassembled easily and efficiently to discharge to the filtrate sump (Fig 2).
Results. The discharge mod has reduced the total time it takes to perform a CIP by two hours and has saved up to $700 per CIP. This gives the site greater control over the pH level in the WCS, thereby mitigating the risk of non-compliance with the site environmental permit by not discharging directly to the WCS. Additionally, this mod improves employee safety by eliminating exposure to chemicals for neutralizing pH.
Project participant:
Shawn Burnette
Benefit of using Python to calculate plant performance
Background. Annually, PJM Interconnection requires all plants in its territory to perform an installed-capacity test (iCAP). It is equivalent to the claimed installed capacity in PJM eGADS, and the capability of the generating unit at the expected time of the PJM summer peak. This also is referred to as the “rated capability” or “rated iCAP” which is determined by adjusting plant capability for site conditions coincident with the dates and times of summer peaks over the previous 15 years.
Challenge. The plant had been using an Excel spreadsheet that relied on macros to calculate correction curves for the given ambient conditions of temperature, barometric pressure, and relative humidity, and the 15-yr summer condition averages for those variables.
Correction curves provided by the OEM only included certain ambient conditions, and they required mathematical interpolation to obtain the proper correction factor. To illustrate, Fig 3 gives curves for ambient relative humidity with the evaporator cooler in service and ambient temperatures of 59F, 75F, 94F, and 100F.
After the iCAP testing was complete and all PI data were input to the Excel spreadsheet, site and other performance engineers would question the validity of the Excel result. The discussion related to the “correct” number to use would go back and forth for multiple weeks for each test. This resulted in numerous manhours being used for debating whether the Excel output was correct or incorrect.
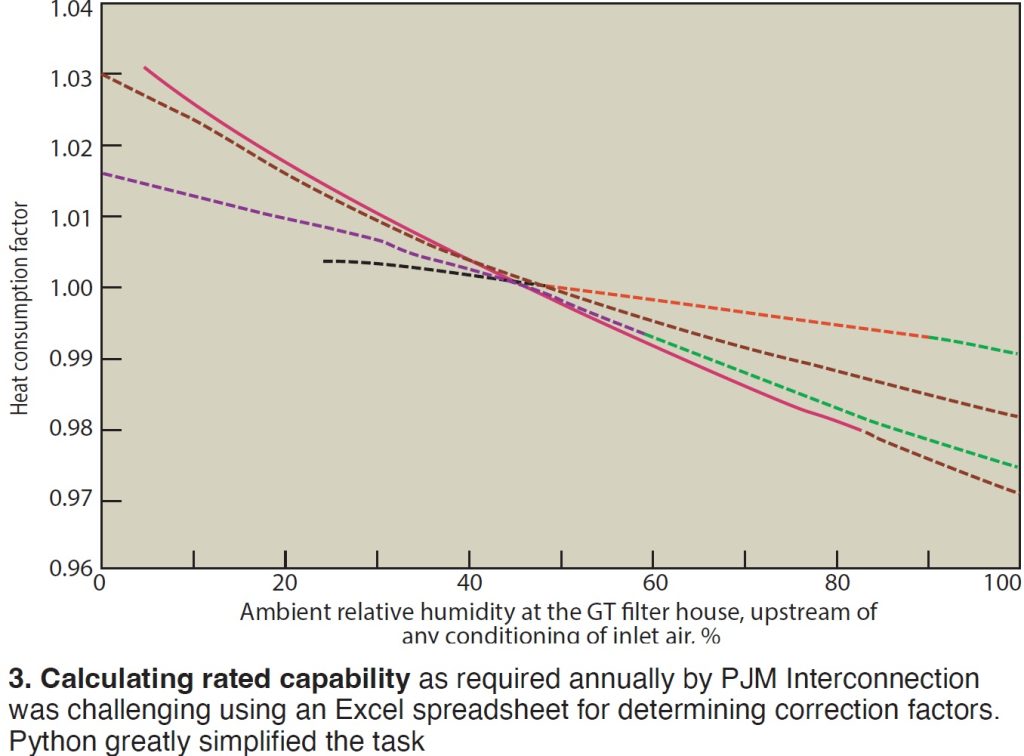
Editor’s note: The complex equations used to create the curves in Fig 3 were submitted with this entry, but believed to be of marginal value to most readers and not included here. Please contact Jacob Boyd, plant engineer, if you are interested in digging deeper.
Solution. The best way to facilitate the process was to develop a written code within the computer programming language Python, an interpreted, object-oriented, high-level language with dynamic semantics. In short, it’s a powerful tool to develop a proper calculator for all the curves used in calculating the iCAP net generated output. The program includes approximately 300 lines of code—including equations for interpolation.
A sample of this code was provided with the entry but not included here given its very limited value to the large majority of readers.
The benefit of using Python for calculation of the iCAP is that it takes the human error out of calculating the iCAP value within the Excel spreadsheet, which required annual updating depending on how ambient conditions differed along with the PJM summer peaks. With Python, the only thing the site team must do is insert the numbers for temperature, barometric pressure, and humidity, and the 15-yr averages for each, into the program and press “run.”
After all the required date are input, Python returns the proper correction factors used, plus the corrected net output of each unit to be submitted as the iCAP number.
Results. Since the implementation of Python and validation of the code via hand calculation, the man-hours of involvement required of management—including plant engineer, operations manager, and plant manager—to develop the iCAP number for input to the PJM portal have been reduced dramatically. In addition, the new methodology is so user friendly operators can use this tool during the iCAP test to ensure the plant is on track for hitting the target corrected net output.
Project participant:
Jacob Boyd, EIT, plant engineer