
Jason Makansi, Pearl Street Inc
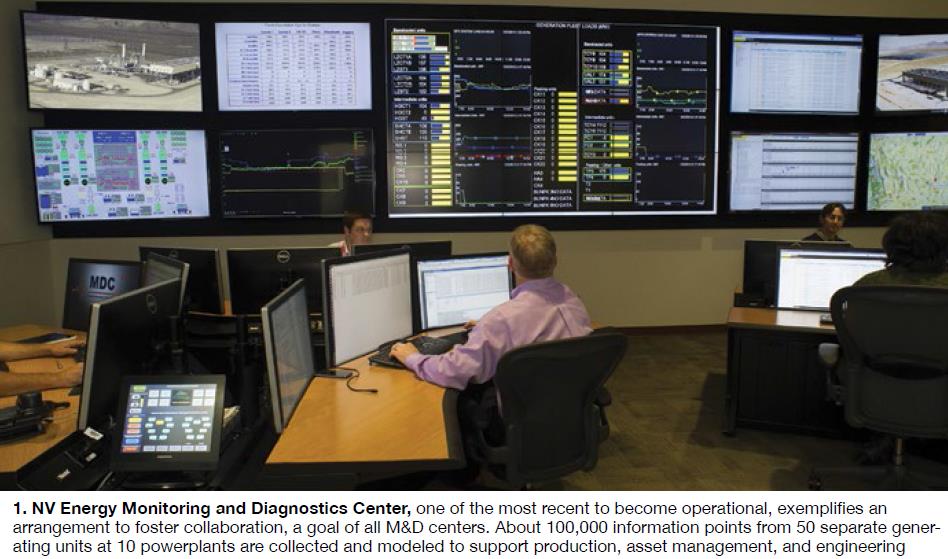
Many large and mid-size utilities and independent generating companies have installed fleet-wide monitoring and diagnostics (M&D) centers (Fig 1). While the practice began more than a decade ago, in many ways, it is now poised for even greater expansion, thanks to breathtaking growth and declining cost of backbone digital chip technology, cloud computing, wireless sensors, mobile and hand-held digital devices, and robust algorithms and analytics.
However, the digital architecture of fleet-wide M&D is likely to change over the next decade. Technology promises to pose fewer challenges than optimizing how technology fits into organizations. As one example, the notion of “aggregating” the digital signals and human specialists in one centralized location is somewhat specious, given that the data can be, and often are, made available anywhere on most any digital device (within security limitations of course). Likewise, collaboration can take place anywhere too, with a camera and a microphone on the computer, or over mobile hand-held devices.
In short, the concept of a “center” may be an artifact of an industry focused on centralized utility grids. The concept of a “cockpit,” though, may have more staying power, as it implies face-to-face collaboration, perhaps more vital during emergency and upset conditions, to ensure all of the available expertise—human and automation—is being brought to bear in coordinated fashion.
Some perspective
Before the industry had 1300-MW coal-fired units, there were (and still are) 1300-MW coal-fired stations comprised of five to 10 individual units. At one time (circa 1950s), such a plant might have been built with two control rooms, each serving a bank of units. In an earlier time, each unit might have had its control/monitoring room, with much of the actual control localized at the equipment.
Today’s remote M&D center is simply part of this evolution, made possible by wired and wireless data networks and telecommunications. Also, in an earlier time, many plants had a “results” engineer responsible for calculating and monitoring performance—especially heat rate. Maintenance was performed largely on a preventive basis, machines routinely disassembled, inspected, and re-assembled, and components replaced based on an operating-hour schedule.
Being a fully regulated, cost-plus, assigned rate-of-return industry completely focused on reliability helped maintain this status quo until deregulation and competition became more than glints in the eyes of financial engineers by the 1990s. More recently, combined-cycle plants became more and more similar as they were built around standard gas turbine, steam turbine, and HRSG modules from OEMs. With a far more homogenous fuel than coal (natural gas), comes greater commonality in plant design, which allowed for more distributed expertise to manage these assets.
The enablers
On the technology side, the enablers of fleet-wide M&D include the following:
- Distributed digital control systems (DCS) progressively installed at powerplants beginning in the late 1980s.
- Data historian and storage technology capable of taking the data from a proprietary DCS and converting them into a standard format usable by software applications.
- Data highways and data networks employing standardized communication and routing protocols, including over the Internet, allowing further propagation of plant data.
- Computer hardware and software operating on non-proprietary desktop and PC operating systems.
- Inexpensive liquid crystal displays (LCD) and digital displays in larger and larger flat-screen formats, and in the other direction, ever-more-capable mobile devices and tablets that have essentially become hand-held computers.
Whether a bricks-and-mortar “central” facility exists or not, the remote M&D concept is driving the integration of digital powerplant assets.
Behind the dashboard
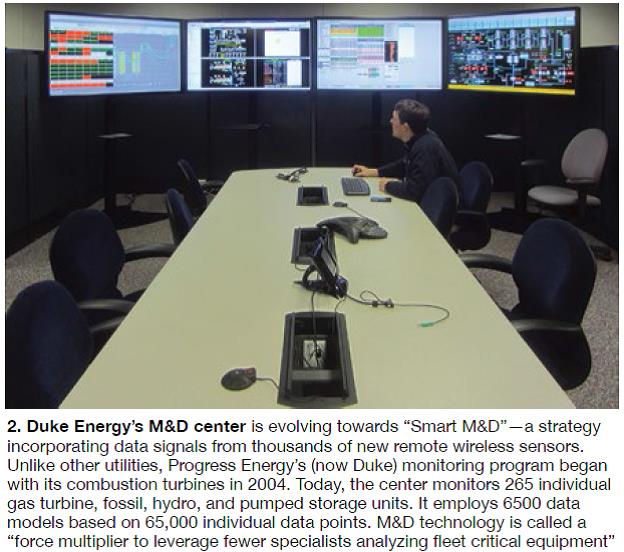
Though you’ll find a veritable suite of software applications from different vendors at the typical M&D center (Fig 2), the two “anchor tenants” are thermal performance monitoring and advanced pattern recognition (APR) to calculate efficiency and detect equipment anomalies and deviations.
 Online heat-rate calculations using real-time data from the DCS have been going on for decades. At coal-fired plants, the calculation has been limited by a lack of real-time data for fuel analysis. However, for gas plants, hour-to-hour or day-to-day fuel variability has far less impact. According to at least two M&D center managers, what is different today is that real-time heat-rate values are being used for capacity dispatch into electricity markets.
Strange as it may seem, many plants still are dispatched based on heat-rate calculations from annual or periodic performance tests. Today, leading fleet owners dispatch on real-time calculation—taking into account ambient conditions, current equipment condition and performance, cycling and less than design load, and other factors. M&D center specialists can alert plant staff about controllable losses, and changes they can make to maintain or improve unit efficiency, much earlier than without real-time performance monitoring.
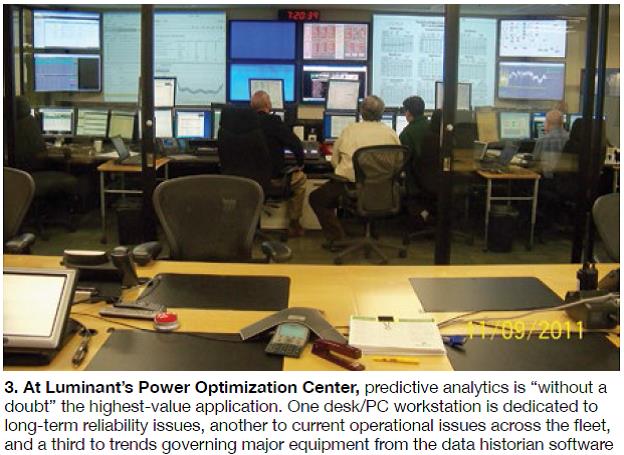
Use of APR technologies is more diverse than heat-rate monitoring. At their core, all of these software solutions trend data points (or tags)—individual data points from the DCS through the historian, taken at high frequency (called data resolution). For example, one package popular at M&D centers trends data taken every 10 minutes (Fig 3). By comparing and correlating real-time versus historical trends on selected parameters for a given piece of equipment or system, deviations or anomalies from known patterns can be detected.
 In their simplest form, APR techniques provide warnings and alerts much earlier than would be annunciated by the control system. Plant operators typically don’t have the time, and/or aren’t trained, to detect such anomalies. They are more focused on making sure things are running smoothly, not long-term issues.
One M&D center specialist, reporting at the 2013 conference of the Combined Cycle Users Group (www.ccusers.org), showed how the APR model detected a 2× shift on all of the generator proximity and seismic probes of a gas turbine/generator. Normal vibration levels are less than 1 mil. During the last run before an outage, the APR showed trending up to 1 to 2 mils. Learning of this, the plant staff removed a porthole and found that both generator J-straps were damaged. Subsequently, the plant repaired the damage in the field. Had this condition gone undetected, the probability of a J-strap failure during the next season’s run would have been high.
At a more sophisticated level, M&D center specialists build models for specific components based on known or suspected failure conditions (often incorporating machine fleet experience) or after a failure has occurred, so that the precursors to that failure can be detected the next time. Specialists at several M&D centers, for example, report that they can anticipate when the combustor liners in their gas turbines are about to fail.
When the capability goes beyond an early warning, diagnostics jumps into the realm of prognostics. This simple analogy explains the difference: Diagnostics says you have cancer, prognostics says you have six months to live. In practice, prognostics capability accompanies early warning with some assessment of risk or time to failure—some sense, anyway, of how much time you have to deal with the deviation.
The crux of APR technology implies the need for large data sets at steady-state operation. After all, the steadier the operation has been, the easier it is to detect deviations from the patterns. This poses a conundrum for gas-turbine peaking and combined-cycle plants, which typically are cycled, dispatched, and start/stop frequently.
Most of the APR models have been built and proven for base-load and intermediate-load duty. Though the experience base is not as robust, GT/CC operators have prevented catastrophic equipment wrecks by diagnosing faulty bearings, generator J-strap failures, HRSG attemperator failures, nozzle issues following hot-gas-path (HGP) overhauls, blade rubs, and other anomalies by applying APR.
One way to address the challenges posed by transient operation is to take more data within shorter time intervals. At least one APR product designed for GT startup periods, for example, takes data every second, compared to the company’s standard product which takes data at 10-min intervals. This capability allows you to compare one “startup signature” to another. Several M&D centers report using or testing this product but not necessarily getting enough value from it.
Another issue with GT applications is to make sure the models are properly tuned. As one M&D center specialist put it, “tuning a model at 70F ambient temperature is not the same thing as tuning it at 90F.”
Feed me data
If APR and thermal performance are the core monitoring technologies, the data historian and data network are the backbone that makes the M&D center possible. The leading provider of this system has trending tools as well, although in general, most users report they are not as easy to use, or as robust as the customized software applications which pull from the data repository.
In a typical setup, data from the plant DCS is pulled through a firewall into the plant local-area network (LAN). From here, the data historian server pulls data from the LAN. This involves tens of thousands of “tags,” not all of which are actual measured variables, but include tags for data quality, performance equations, manual entry, data conditioning, notifications, and others.
Each plant data historian server in turn feeds the owner/operator corporate wide-area network (WAN), usually over the Internet. Corporate IT receives data, monitors the status of the servers, stays abreast of security patches, and reviews signature files. Process data are directed to the M&D center.
Instrumentation is one of the big technical challenges with APR. This is especially true at gas-turbine-based generating facilities. It has been true for decades that the majority of reliability issues at GT plants, especially starting reliability, are associated with I&C. A representative of one owner/operator who recently started up an M&D center notes that instrumentation issues comprise 50% of the advisories.
In fact, identifying over 500 instrumentation issues across the fleet proved to have value on its own. Many of these issues were known by the plants but considered low priority because they involved monitoring and not control. For other owner/operators, I&C related advisories have been reported to be as high as 70%, especially in the early phases of building and training models.
No ‘big brother’ here
One of the prevalent justifications for M&D center investments is a solution, at least a partial solution, to the “brain drain”—although the great recession probably has made this less of an issue. Management sees talented, experienced human resources spread across multiple plants, supported by advanced technology, as a means of reducing personnel costs without sacrificing, and hopefully improving, on standard performance metrics of efficiency and reliability.
Another driver is having at least a more consistent version of the truth. Aggregating the data and knowledge makes it easier for everyone to share, avoiding silos of knowledge, and ensuring that experienced people who leave or retire don’t take the keys to the O&M kingdom with them.
Integrating remote M&D technology into operating organizations continues to pose challenges, especially in establishing trust and cooperation with the plant staff. One of the earliest challenges was avoiding the “big brother” label. Folks at the plant resented the “oversight” of what in the past would have been their responsibility. Virtually every M&D center has had to face this issue in some way.
Another early complaint from the plant-side was that the best operators were transferred to the M&D center, leaving gaps in the plant talent and experience base. It’s easy to see how this can quickly spiral out of control. Less experience and talent at the plant means more problems which are then detected and resolved by the M&D center staff.
The third challenge is communicating with the plant staff—in particular, avoiding false positives that could inundate them with meaningless emails and reports which generally get in their way rather than ease their work lives. All M&D centers now strive to thoroughly validate and vet all indications before notifying the plant. In fact, many of these facilities are no longer called M&D centers. Instead, they have names like operations support, performance optimization, and performance center.
One M&D facility faced these challenges squarely by drawing a bright line between responsibilities and redefining the mission. If an indication is one with potentially an O&M impact within the next 24 hours, it is the responsibility of the plant; if longer, it is the responsibility of the M&D center. The mission, therefore, is about reliability and long-term condition-based monitoring, not day-to-day operations.
The struggle to balance human resources with technology continues, however. One specialist reports that building accurate models would have been far more difficult if they hadn’t hired a vendor startup engineer. The best practice here is obvious: couple an equipment expert with a data and modeling expert. Other specialists report that such equipment experts are in short supply and high demand today.
The ebb and flow of utility management decisions also weighs on M&D center staffing. Several M&D centers had experts deployed 24/7/365. Now, the staffing has been cut back, in one case to the daytime shift only. Another center reported that they no longer monitor unit startups, and that staffing with two specialists 24/7 had recently been cut to two specialists only during the day shift Monday through Friday.
The irony here is rich, because the less-experienced, less-talented off-shift operators probably need the support more than first shift. But the management logic is obvious, too: Most parts of the country are awash in capacity. Units out of service don’t make as much of an impact as, say, five years ago. Executives at many utilities have shifted their focus to transmission construction, and away from generation.
It is no surprise that the interface between M&D centers and plant staff proved a contentious subject during a session devoted to M&D centers at the CTOTF™ 2013 Fall Conference (www.ctotf.org). One seasoned operator asked whether such technologies “dumb down” operators. Others stress that, no, the idea is to make operators smarter by putting better information in their hands for making decisions.
Real-time financial management
The holy grail of fleet optimization could be called dynamic financial management. Imagine your plant’s budget is no longer static, based on an annual review, annual capital spend, and O&M targets. Instead, your budget is dynamic, changing every day, maybe even every hour, based on the current condition of critical equipment. At the same time, all the operating costs are known (within some error bands) in real time, and that information is used to dispatch the entire fleet.
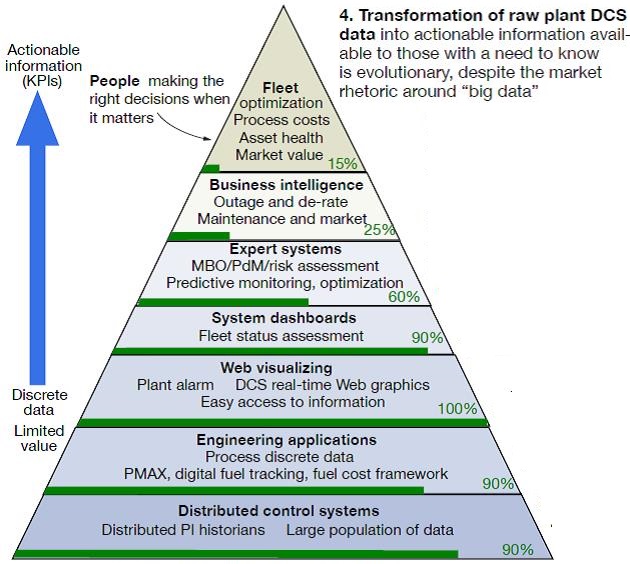
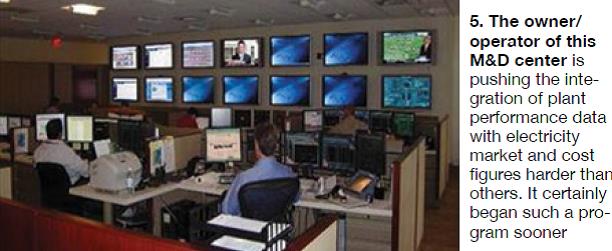
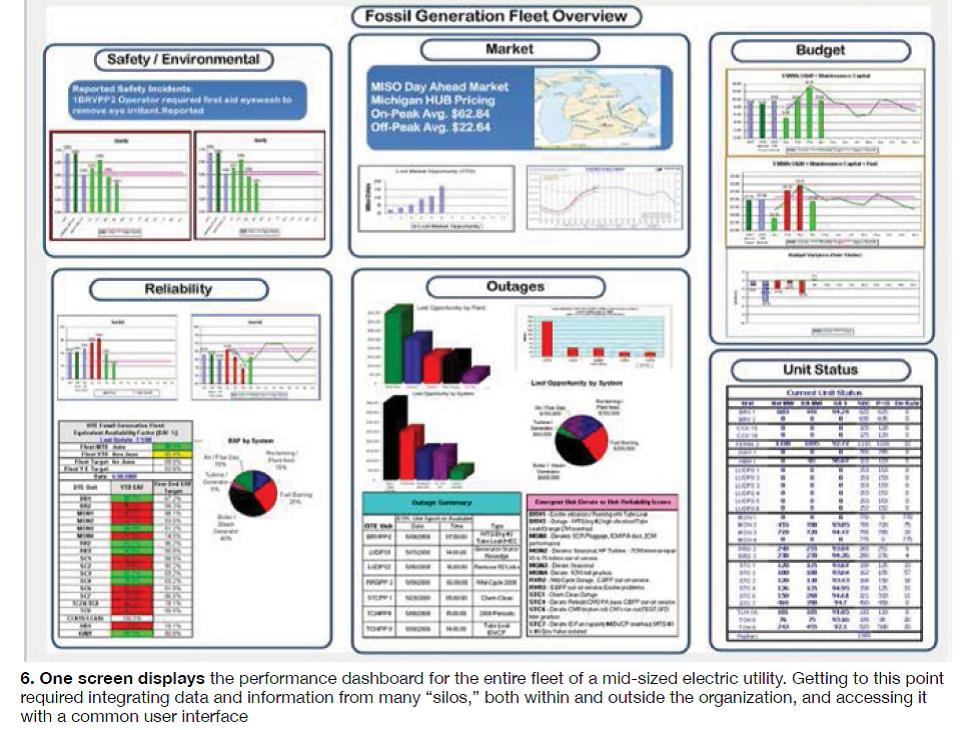
At least one fleet owner/operator dared to have this vision (Fig 4) more than seven years ago, and continues to work towards it, an effort anchored by its remote monitoring center (Fig 5). Over time, the effort incorporated recent wind-turbine additions, market information required by the ISO, and interfaces to the plant CMMS and enterprise business management systems (Fig 6).
The author saw a version of the Fig 4 graphic six years ago. The percent-complete figures along the right side of the triangle are the same, except the one for system dashboards, which has risen to 90%. Similar to using real-time, heat-rate calculations for dispatch, making the transition to a truly data-driven fleet operator basing decisions on real-time cost-based key performance indicators (KPIs) doesn’t happen overnight. “Big data” is evolution not revolution.
Glimpse into the future
A smarter or less-capable operator really isn’t the issue. Automating repetitive tasks through technology has always been a persistent driver of change and cost management in industry. Getting the right information to the right people at the right time is the issue. One need only understand that airline pilots are essentially trained today as overseers of the plane’s automation system.
Simple-cycle gas turbines are routinely started and stopped remotely and have been for decades. Combined cycles start up at the push of a button. Almost 20 years ago, the author visited a 1400-MW coal-fired plant in Australia that operated (and still does today, according to a recent report) with only two people onsite during the second and third shifts. Much of the monitoring and control was shifted to a central dispatch facility.
Fact is, M&D technologies can be more closely coupled to control systems so that they achieve “closed loop control,” taking the human operator out of some decision loops. Although control-system suppliers are sensitive about taking deep dives into unmanned plant operation, they are ready to embed M&D and prognostics into their control-system architectures, hardware, and software.
At the CTOTF conference referenced earlier, a top executive for a major control-system supplier focused his remarks on prognostic control, how sophisticated data analytics and big-data algorithms can be combined with super-fast simulation to inform real-time decisions. In this way, monitored variables are tracked and compared using multi-variate techniques and the control system is run, in effect, in fast forward to predict how the plant will respond.
The latter is performed using a virtual model of the control system that runs in parallel with the real plant control system. Much of this capability can now be embedded in the controllers, avoiding separate systems pulling from an independent data historian. In another paradox, such capability may ultimately obviate the need for a remote M&D facility.
The application of wireless sensors is clearly the next front in M&D and prognostics. Specialists at one M&D center say they plan to add thousands of wireless sensors for vibration, temperature, electromagnetic interference (EMI), and other variables across its large regional footprint of assets, as well as build at least 1000 new APR and prognostics models to use the data.
At another facility, one full screen is dedicated to trending and displaying the data from remote wireless monitors across the fleet. According to users, wireless sensors cost as little as a few hundred dollars each. A typical combined cycle could have 300-400 new monitored points, a simple-cycle GT 50-60.
Consider how inexpensive direct measurements can also change the architecture of M&D. One of the reasons APR techniques became so popular was because direct measurements at power stations were limited. Supervisory systems for gas-turbine plants provided by the OEM, for example, are expressly intended to prevent catastrophic failures, not provide 24/7 indications of deviations, faults, equipment condition, etc. APR does a great job with the available measurements, but a machine more intimately instrumented for 24/7 diagnostics and trending may no longer require opaque black box algorithms for trending and correlations.
The upshot is the human-technology equation may flip again. With more of the right data from inexpensive sensors, it may make more sense to locate specialists at the plants, or consider them roving with no home base. Let’s face it, the data aren’t at the plant or an M&D center; they’re in the “cloud.” No reason why the equipment specialist, the plant operator, maintenance planner, OEM representative, and others can’t meet virtually and discuss the issues.
A third piece of technology promises to facilitate such meetings: 3-D visualization. Owner/operators today can laser scan the as-built plant environment, convert the scans into virtual digital models, and reference all of the data about the equipment through standard points and clicks. We’re not talking about crude 3-D models used in graphics packages, but high-resolution, high-fidelity graphics of the as-built environment—almost as clear as photographs.
Only a few powerplant owner/operators are moving in this direction at the moment, but the petrochemical industry is embracing the technology. Taking this a step further, some plants are discussing mounting video cameras and audio devices around the plant. The operator can’t put his or her screwdriver on a machine and “listen” to it, as in the old days, but such surveillance would help detect leakage, changes in sound, and other ambient conditions.
Finally, integrating simulator capability is another coming wave. Already, some plants are equipped with M&D software that allows previous operating intervals and conditions to be replayed and studied for improvements. For the future, control-system vendors are promising fast-forward capability, the ability to run the simulator, essentially with a high-fidelity replica of the control system, in parallel with the DCS. This is tantamount to sending a spy to survey the landscape before you commit forces to battle.
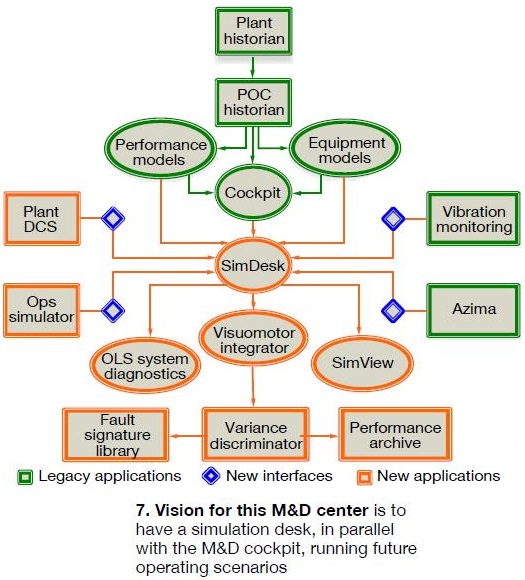
Specialists can play “what-if” scenarios with control parameters to see how equipment/systems respond, not in real time, but ahead of time. In one configuration, a simulation desk complements the M&D center cockpit (Fig 7). CCJ