

 The annual conference of the Combined Cycle Users Group (CCUG) was conducted online for the first time in 2020. The presentations summarized below took place during Week 3 of the conference and are available to owner/operators on the Power Users website. Access Week 1 (User presentations) and Week 2 (GE Day) recaps here. More to follow…
Subjects covered during the CCUG’s Week Three session ran the gamut from what you can bring into (or catch at) the plant to what your facility discharges out the plant—and much in-between. ALL presentations—both user and vendor—are available on the Power Users website for on-demand viewing.
Pandemic viruses. Probably nothing was top of mind like Covid-19 and so the day began with the presentation, “Covid Best Practices.” First slides reviewed the Covid personal practices we’ve been seeing and hearing about for eight months in the news.
Then the presenter drilled down to in-plant practices, specifically changes to outage execution. Some of the basic steps include the following:
-
- Daily site employee and worker temperature monitoring for fever.
- Segregating day and night shift staffs and decreasing shifts by one hour to avoid overlap.
- Phone- or digital-based shift turnover.
- Increased social distancing during the shift by holding morning toolbox and shift turnover meetings outside (weather permitting) or in rented trailer, separating crews into teams with different break schedules, and adding a separate trailer for work crews.
- Increased personal hygiene and addition of wash stations around the site.
- Wipe down of tools at the end of each shift for the next crew.
- Additional personnel protection equipment (PPE) in areas where 6-ft distance could not be maintained (confined spaces, for example).
- All vehicles limited to one worker per trip.
- Frequent cleaning of all high-traffic surface areas like refrigerators, microwaves, coffee pots, door handles, etc.
The presenter underscored the need to be aware of heat-related stress from wearing masks for long periods in hot environments (such as above 90F), and a need for a solution to crowding at emergency muster points.
The Q&A session got interesting. Illustrating a non-obvious tradeoff of one safety issue for another, one plant rep noted that they had to back off on safety audits and suspend fire drills to minimize person-to-person contact. One user expressed frustration that they couldn’t get the right tech-support folks into plants because of local, state, and national restrictions. In an extreme case, this caused scheduled hot-gas-path (HGP) maintenance to be deferred.
Another facility modified smoking areas and port-a-potty units to keep groups isolated. At least two plants added portable heated-water hand-washing facilities, one said to include a tankless water heater, to encourage longer hand-washing.
Unfortunately, no one had any good way to track workers offsite, behavior that could nullify whatever good practices were occurring onsite. Craft-labor supervisors, the presenter said, were responsible for ensuring that crew members only traveled from hotel to site. Lunches were served onsite to avoid unnecessary offsite travel.
Safety. The next presentation, titled “You Have to Be Present to Win,” addressed safety issues, with Covid-19 being the most recent challenge added to the safety basket. It’s worth getting the slides for the photos of a GT major outage during a pandemic. Some of the specific steps taken at this plant:
-
- Substituted a safety-orientation video and a downloadable Excel spreadsheet for the in-person site orientation session.
- Replaced break trailers with tents, provided by a local contractor, equipped with lights, heat, tables, chairs, floor, etc.
- Added two remote hot-water hand-washing stations.
- Held daily contractor meetings in an open, ventilated shop area.
Speaker opened with the personal experience of an injury during a family outing to illustrate “what we do at home affects our work,” and then recounted the experience of a serious accident at the plant as a reminder that “we work in a dangerous environment.”
That set the stage for a discussion of six enemies of safety: complacency, stepping through the motions without thinking about what you’re doing; poor housekeeping, taking the time to clean up and avoid shortcuts; fatigue/lack of focus, especially during long outages and when workers are offsite; deadlines, distinguishing between real and implied; lack of training, “feeling” what’s happening with the equipment in addition to “knowing”; and trusting without verifying, such as taking the time to know what is going on in a LOTO area.
Reporting “near-misses” is key, the speaker stressed, and with follow-up training on the precursors to them.
Two slides list a baker’s dozen of “items to consider.” While most are the usual reminders when plant safety is addressed, a few of the most salient are these:
-
- Require workers to state what they are doing instead of just doing it when signing off on work permits.
- Consider taking the most conservative option when making an on-the-spot decision about safety.
- Encourage an open mind when personnel suggest solutions and “hear” employees’ safety concerns rather than just listening to them.
One listener encouraged attendees to adopt OSHA’s Voluntary Protection Program (VPP) process to strengthen their safety programs. VPP plants invite OSHA representatives into the plant to guide them in how to do things more safely. Presentations at previous CCUG conferences have addressed the OSHA VPP process. Access them on the Power Users website.
Another attendee conceded that training new employees during a pandemic presents opportunities for improvement. One concrete idea is to upload a virtual orientation to YouTube with a QR code for workers who didn’t see a video before they arrive at the site.
Inspections. Remotely inspecting high-risk areas is another facet of safety. The next speaker presented experience with remote camera inspections of LM6000 and 7EA peaking-unit compartments. This is a specific solution based on a GoPro camera and a digital monitoring device.
Craft labor in this utility’s peaking-turbines department sought a system that would be safe, avoid unnecessary tagouts for things like oil leaks, and not violate the gas-turbine OEM’s requirements—such as the prohibition of entering a turbine package during operation. The solution selected features off-the-shelf components costing at most $1500, rather than expensive stationary cameras. The camera sits in a mag base with remote mounts, while the monitor stands outside the GT housing.
This was also a case where putting the minds of your younger workers to bear on the problem pays dividends, the speaker noted.
The apparatus has already proved its value in detecting water leakage in a GT package following a shutdown and confirming its source (NOx injection water line), detecting smoke emitted from the turbine compartment and confirming its source (vent fan), as well as for conducting condition assessments of inlet-house fogging nozzles and evaporative cooler media, and for monitoring an oil-consumption sight gage.
Generally, any piece of equipment inside a housing can be monitored and recorded externally during operation for an extended period.
Questions included whether the components are explosion-rated and “intrinsically safe” and what the high-temperature limit is (answer, 400F for direct contact, but does not actually contact hot surfaces). One commenter noted that such cameras have also been used in place of borescopes for “troubleshooting insight.”
Market competition. As if it wasn’t yet clear, the presentation titled “Renewables Are Coming” made unassailable the coming competition to gas-fired plants from solar and wind. And if you don’t like that, you can no longer blame it solely on government mandates.
Eight states now require 100% renewable energy by 2045 and five others have 100% renewable “goals.” Large high-profile corporations like Facebook, Google, Microsoft, and other digital-economy leaders, the speaker noted, plan to either build or buy 72 GW of renewable energy by 2030 for their electricity-hungry server farms and other needs.
That’s the demand side. On the supply side, the presenter noted that solar photovoltaic (PV) systems have dropped in cost from $3.50/watt to 50 cents over the last 12 years, and their active-power control capabilities have greatly improved. Grid-scale battery systems, which assist in load management, also have dropped in price by 70% between 2015 and today.
“Lots of states already show solar and wind to be the least-cost capacity options,” observed the presenter, “and only a handful of states show gas-fired generation as the least cost option in 2030.”
There are unintended consequences, however. For example, smoke from the California wildfires this past year decreased solar generation from existing facilities by around 30%. Guess which plants would be making up that loss on a moment’s notice? Yup, gas plants.
Another consequence of the strange year called 2020: Utility system loads shifted dramatically, because of COVID, from commercial facilities to residential units. Zooming takes electrons.
Most of the bulleted items on four slides about how to adapt GT units to this coming onslaught are probably more than obvious to most users and have all been topics of one or more presentations during prior CCUG conferences, including the future potential for hydrogen produced by renewable sources as a GT fuel.
HRSG drum wall cracks. Anand Gopa Kumar, analysis manager, HRST Inc, coached the audience through a relatively new onsite crack-size assessment technique, conducted along with ALS Industrial Services, that has now been demonstrated “on a few HRSGs.” The technique, which follows API 579 and ASME-FFS-1 standards, combines transient thermal simulation (based on finite-element analysis) crack growth under drum operating conditions with standard NDE crack inspection methods—including magnetic-particle and ultrasonic testing.
![]()
The deliverable, if you will, is a failure assessment diagram (FAD) of the areas under investigation which reveals critical crack size (Fig 1) as a basis for decisions about remaining life, additional run time, etc. In other words, measure the crack dimensions (length and depth) and project their growth (assuming other variables are fixed) over the next operating cycle.
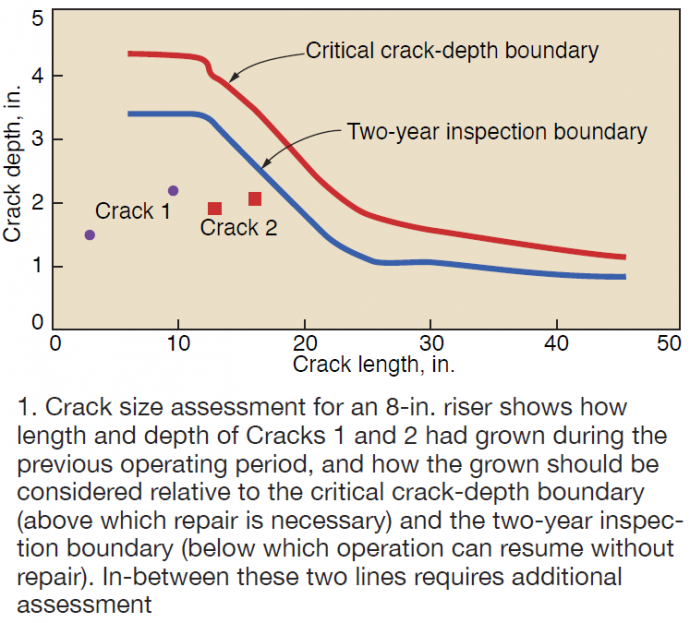
“All high-pressure drums should be periodically inspected but the thicker HP drums are most at risk,” Kumar said, with the area of greatest risk being the surfaces exposed to the 0-400-psig pressure range where the fastest temperature rises are experienced. “Thick cold drums plus fast pressure ramp equals stresses at the large nozzles,” Kumar noted. The shell-to-head area is also susceptible to cracking.
A typical F-class HRSG HP drum needs around eight different FADs, one for each of the major weld locations. The technique is best performed before an outage, so that relatively quick decisions can be made on repair during the outage versus continued monitoring.
The technique is applied to ID wall cracks, since removing insulation from the OD side usually is impractical or not possible. However, Kumar said, some cracks at OD weld areas can be detected from the inside. The analyst also has to consider adjacent cracks and the potential for crack interaction. “Sometimes cracks close together should be considered a single larger crack,” he said.
Many of Kumar’s slides were devoted to pre-outage, start of outage, and in-testing work.
Pre-outage work includes organizing the information—such as design drawings, operating profile data, historical repair procedures, photos, and any other previous inspection results or condition reports. Drum weld areas need to be properly exposed, cleaned, and prepped for NDT, and drum internals removed. Less obvious: Install snug-fitting foam plugs in nozzles to protect them from foreign objects and install lanyards on all tools if open holes exist.
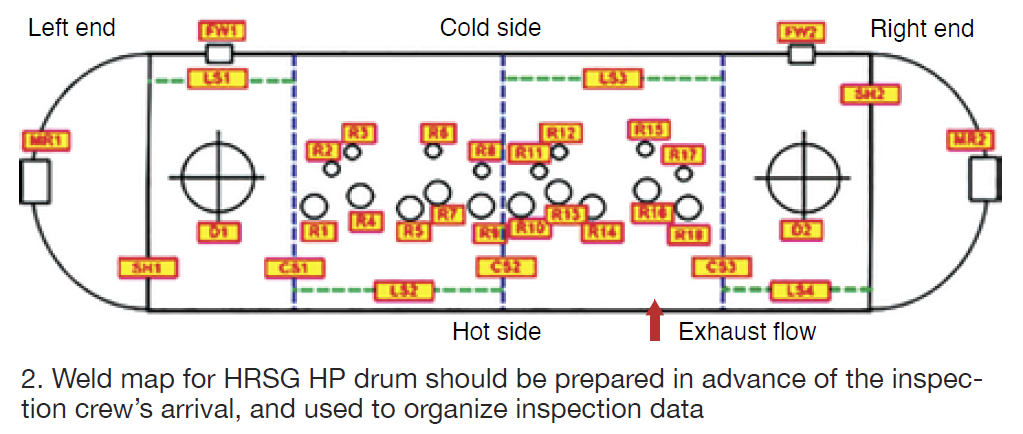
At the start of the outage, inspect surface prep before the NDT crew arrives, label each weld location with paint stick per the drum weld location map (Fig 2), and protect nozzles from falling objects.
During testing, the technician performs mag-particle tests first, then the phased-array ultrasonic tests to accurately document the start of cracks, while being aware of multiple crack interactions. Length and depth of cracks must both be determined to decide whether more run time without repair is prudent. Decisions whether to leave as is or grind out shallow cracks must be made as well. Minimum wall thicknesses should also be calculated ahead of the outage, using ASME methods.
In response to questions, Kumar stated that fatigue-life calculations are not part of this exercise—these components typically do not operate in the creep temperature range—and it is uncommon to see cracks slow down or stop rather than continue to grow. Performing this technique before a unit enters cycling service can be especially valuable.
Catalyst and turndown. Moving through the combined-cycle system to the NOx and CO emissions catalysts, Andy Toback, Environex, asked in his presentation title, “Is Your SCR/CO System Ready for Turndown?” If your SCR was designed for baseload operation, the answer is probably not.
![]()
Chemical constituents change at temperatures typical of low-load operation. NO2 from the gas turbine gets elevated and CO from the GT exhaust can “grow exponentially at low loads,” because the operating-temperature range has shifted. Toback then turned to two case studies to illustrate his points.
The plant in the first case was experiencing ammonia flows higher than design, sometimes twice as much, even at low loads, and low NH3 vaporizer temperatures at high NH3 flows. The NO2 fraction of NOx was measured consistently higher than 50%, and as high as 70%, during startup. Normally, it should be around 20% NO2/NOx.
Nevertheless, both CO and NOx catalysts were performing well. However, the CO catalyst was also oxidizing NO to NO2, so the SCR catalyst had to work harder neutralizing the elevated NO2 levels, acting as if it was near the end of life, asking (through the control logic) for additional NH3 spray.
“The catalyst was behaving perfectly for the baseload conditions it was designed for,” Toback reported, “but to operate at lower loads and meet permit limits, it would require 20% additional volume and 0.6 in. H20 additional pressure drop.”
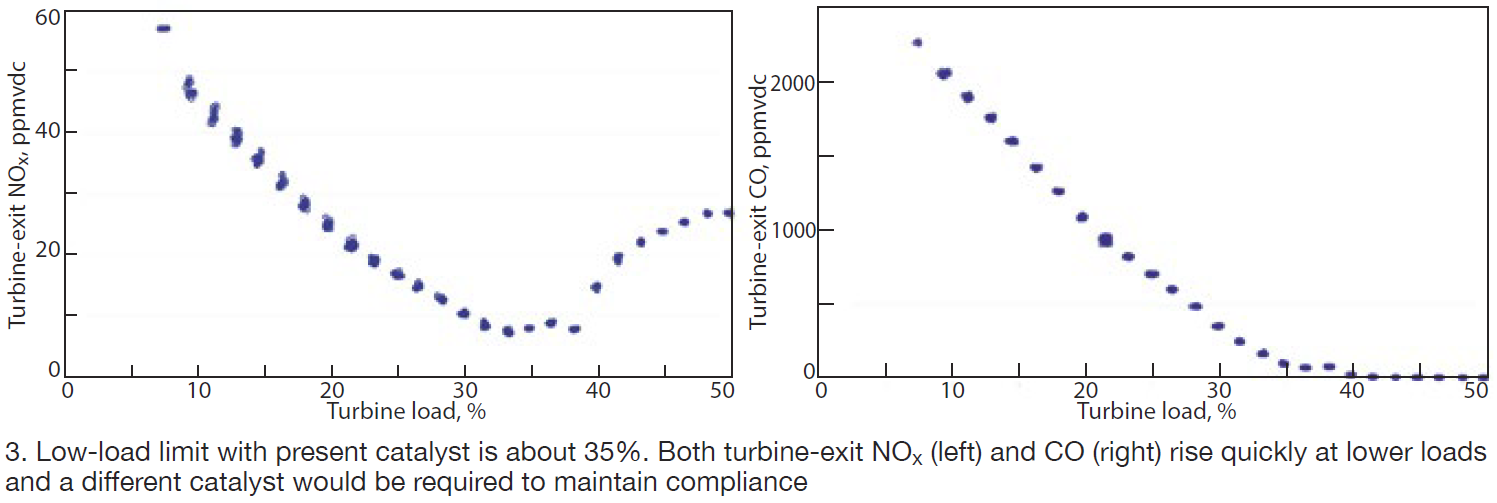
Toback called the second case study a “turndown field exercise.” The test crew measured steady state catalyst operating temperatures and CO and NOx concentrations in the GT exhaust down to 8% load. The goal was to determine what turndown levels the plant could run at with available catalyst configurations. It turned out that 35% was the load limit with the present catalyst. Both turbine-exit NOx and CO levels (Fig 3) rose precipitously below this point.
“This plant could get to a 28% load limit if they replaced the present CO catalyst with a dual-purpose formulation,” Toback concluded. While this approach could prove worthwhile for some plants facing extended operation at extreme turndown levels, this plant opted to stick with what it had. In addition to the larger catalyst volume, there is a pressure-drop penalty.
One questioner asked what the catalyst concerns would be running the plant at higher-than-design loads. Answer was that the anticipated life of the catalyst would have to be modified based on the operating data post-uprate.
Another asked if catalyst degradation is gradual or “falls off a cliff.” Answer was that NH3 consumption tends to increase exponentially and catalyst deactivates quickly near end of life. Short answer, probably. Catalyst needs to be tested periodically, and “married up to operating data,” to keep from approaching the cliff, especially after the OEM’s warranty period, to establish a baseline. “Early catalysts were over-designed,” Toback noted, “while later CC/GT facilities have catalyst supplied more competitively on volume.
In the Environex virtual breakout room, discussion continued on topics such as these:
-
- How often to clean NH3 heaters. One plant cleans with acid every three years, while another plots wattage to vaporizer exit temperature to predict when the next cleaning should be.
- Options for running at lower capacity factors when your NH3 flow is capped. Check for plugged nozzles in the ammonia spray array, and try to tune the unit by measuring NOx and ammonia slip at each point in a traverse (assuming you can reach the sampling ports or add a sampling port grid), and selectively increase the ammonia flow in trouble spots.
- Plants having issues with operation below 40F and above 85F can consider seasonal tuning