
There are nearly as many electric generators at fossil-fired and nuclear powerplants as there are gas and steam turbines combined. So, you might think that with thousands of utility/large industrial-grade generators rated more than 25 MW operating in the US alone, the annual meeting of the Generator Users Group (GUG) would draw hundreds of attendees. Not true: There were just 50 owner/operators at the 2017 conference in Phoenix, August 27-30.
This is understandable. Relatively few electrical engineers have permanent offices at generating stations in this country today. Many of the leading generator experts employed by utilities and independent power producers are located at headquarters and have responsibility for multiple machines fleet-wide—some scores, at least one the editors know has more than 200!
Given the state-of-the-art in generator diagnostic instrumentation and data analysis, which has not yet come up to the level of that available for gas and steam turbines, owner/operators might consider it worthwhile assigning someone on-staff to monitor these electrical machines and report suspicious behaviors to the corporate generator engineer. It’s hard to believe this wouldn’t improve unit availability/reliability and reduce maintenance costs over the long term.
But assigning someone at your plant to keep tabs on the generators is only a small first step. That person must motivated to allocate company and personal time and become sufficiently knowledgeable to contribute to the owner/operator’s goal of continuous improvement. Attending the 2018 meeting of the Generator Users Group, in Louisville, August 27-30, is a good starting point.
That generators are “taken for granted” by the majority of plant personnel should not surprise. One of the reasons for this attitude is that staff often is not aware of the many things that can go wrong with electrical machines, how to identify problems, and what solutions are available to mitigate/correct issues.
CCJ ONsite’s coverage of GUG 2017 highlights, which begins below and will continue in at least one more issue of this electronic publication, offers an opportunity to see the many problems generator engineers face regularly and why the opportunity to meet with other experts (users, OEMs, third-party solutions providers, and consultants) regularly is so important. If you have had relatively little exposure to generators over the years you may get “lost” in the technology. But don’t get frustrated if you don’t understand; just look at the many photos provided and begin to build a vocabulary of new words/phrases you might want to better understand as time allows.
Coverage of the 2017 presentations and discussions is divided into these five sections:
-
- Stator frames and magnetic cores.
- Stator windings and bus systems.
- Fields and excitation systems.
- Operation and monitoring.
- General topics.
Summaries of the 10 presentations contained in the first two subject areas are below. They were prepared by IEEE Fellow Clyde V Maughan, president, Maughan Generator Consultants, who supplied the muscle to get the GUG off the ground in late 2015. Users wanting to dig deeper into any presentation can access the PowerPoint in the Power Users library. Note that Power Users Group is the umbrella organization serving the generator, steam turbine, combined cycle, 7F, and controls users groups.
Members of the GUG steering committee, all of whom have been with the volunteer organization since startup, are the following:
2018 Chair: Ryan Harrison PEng, lead generator engineer, ATCO Power (Canada).
2018 Vice Chair: Dave Fischli, generator program manager, Duke Energy.
Immediate Past Chair: Kent N Smith, manager of generator engineering, Duke Energy.
John Demcko, lead excitation engineer, Arizona Public Service Co.
Joe Riebau, senior manager of electrical engineering and NERC, Exelon Power.
Jagadeesh Srirama, generator engineer, NV Energy.
Stator frames and magnetic cores
-
- ELCID trending, analysis. Ryan Harrison, PEng, ATCO Power
- Electromagnetic signal analysis. Kent Smith, Duke Energy
- Fiberoptic temperature measurement for continuous monitoring. Craig Spencer, Calpine Corp
ELCID trending, analysis
Electromagnetic Core Imperfection Detection (ELCID) is a low-excitation test with wide industry acceptance for assessing core health. Insulation breakdown causes fault currents to be set up as illustrated in Fig A1. A Chattock potentiometer (Fig A2) is used to measure the magnetic potential difference resulting from this current, with the somewhat complex equipment and circuit illustrated in Fig A3.
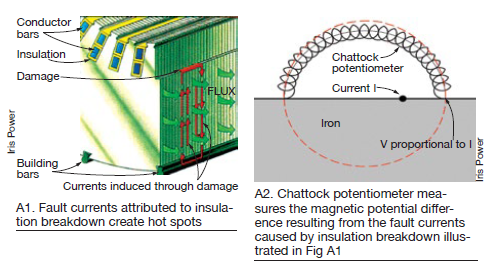
Bear in mind that fault currents create hot spots which can cause further deterioration to the core. If left unchecked, they can lead to damage of the stator core, windings, and the machine as a whole.
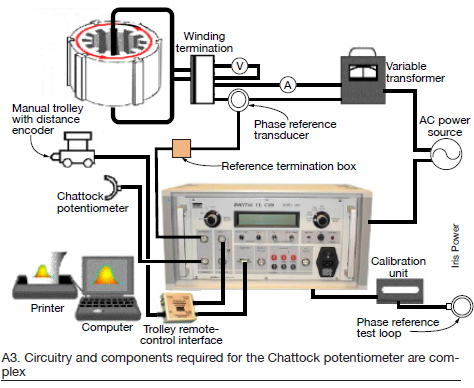
There are several setup challenges important for you to consider during analysis and trending of ELCID test results, ATCO Power’s Ryan Harrison, the 2018 chairman of the Generator Users Group, told attendees—including the following:
Core length. Depending on the operator and OEM versus non-OEM, different core lengths often are used. This leads to scaling issues in the traces and makes exact positioning a challenge.
Polarity. The orientation of the Chattock coil, and the orientation of reference transducer can lead to inversion of the quadrature signal.
Slot numbering. Decide whether to number the slots clockwise or counter-clockwise, and which slot you select as Slot No. 1.
Trending areas of interest. Results are often standalone and on various scaling in the report. This makes assessment of areas of interest more difficult and, in some cases, more judgement-based. In addition, the digital files, which have valuable information such as phase current, often are not retained by the site/tester.
Software. The owner doesn’t necessarily have the software to read the digital file. Furthermore the software is needed to export the values to a usable format. But only software “*.csv” is available; it is free to download.
Filtering. The raw data files have noise, and filtering is applied to the final reported results. While not necessarily a problem it can be valuable to look at the raw data for which the original data file is needed.
Duration between tests. Depending on the machine, the duration can be quite long. Results can be lost over time which is important for establishing baseline values and fault tracking.
Several trending challenges also were discussed and illustrated by Harrison—for example, filtered versus unfiltered, noise, inversion of signal, alignment, vertical scaling, and vertical offset. Digital data can alleviate some of the challenges associated with trending; however, there is not a commercial solution available to help with this review. Harrison presented a scripted Matlab-based solution with alternative graphic representations.
Electromagnetic signal analysis
The signal capture equipment employed by Duke Energy until 2011, Kent Smith, Duke Energy’s manager of generator engineering, told the group, was the EMC30-MKIV; today the Agilent E7402A. National Instruments’ Labview 8.5 program was used to control (standardize) data capture. Frequency of data capture on 74 generators in the fleet was annually on large steam units and so-called Tier 1 gas turbines; “when available” on smaller GTs.
The Labview program data-capture process was in four ranges of 2000 points each, as recommended by AEP /User’s Group: Range 1, 30 – 300 kHz; Range 2, 300 kHz to 3 MHz; Range 3, 3 – 30 MHz; Range 4, 30 – 100 MHz. At the end of each range the program pauses to allow manual capture of peak signatures. The program consolidates all four ranges and displays signature. After signature is saved, the peaks of interest are demodulated, viewed on-screen, and saved to file. The data then are manually imported into Excel for reporting.
Smith, the GUG’s immediate past chairmen, then discussed two examples of data taken, aided by several slides showing signal analyses:
-
- Crystal River Unit 4. It was taken offline for testing in 2005. Results: Passed the Hydraulic Integrity Test (HIT); B phase megger was low (<500 Meg). Online testing in 2005 revealed a small amount of higher-frequency noise. In 2010, the electromagnetic signal analysis (EMSA) signature revealed a “hump” in mid-frequency range and had more of the higher-frequency noise. Work performed in 2010 included rewedging, the rotor mod recommended in TIL 1292, “Generator Rotor Dovetail Cracking,” and repair of five major clip leaks. In addition, the isophase ground flex link at the generator bushings was found pitted and overheated; the link was replaced. A stator rewind was scheduled for 2011.
- Crystal River Unit 5. Online testing in 2010 found high EMSA signatures in the low and mid frequencies. Shaft voltage readings were extremely high (30 V DC) and EMI sniffer was screaming at the exciter end. Later in the year, offline testing found hydrogen seal grounded, the HIT Skid test passed, and B phase resistance was 700 Meg with PI < 2.
The hydrogen seal was coked and pitted (electrolysis). A new hydrogen seal was installed but personnel could not get the new hydrogen seal insulation package to have a very good megger; resistance was acceptable, but suspect. Sniffer readings were still high. A stator rewind was scheduled in 2012.
Future plans include having baselines on all generators (even those for small GTs), developing database on failure mechanisms with signature data, expanding the program to include large motors, developing a continuous online monitor ported to PI for Tier 1 generators.
Fiberoptic temperature measurement for continuous monitoring
While generator core failures aren’t common, their potential impact is up to the catastrophic level. Most generator cores are only indirectly monitored online through embedded RTDs situated between top and bottom stator bars at specific locations in particular core slots. These point sensors offer little protection to the large volume of the core.
Offline core testing, such as ELCID or ring/loop testing, can catch developing core issues, but both tests offer challenges in correlating measured values to actual online temperatures, and neither one offers protection from emergent issues online.
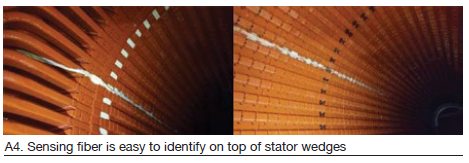
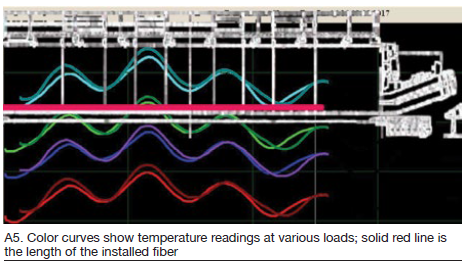
Fiberoptic temperature monitoring shows great promise in advancing core protection by permitting measurement of distributed temperatures along a length of fiber line, Calpine Corp’s Director of Outage Services Craig Spencer told the group. Working with Fiber Optic Sensors LLC and Oz Optics Ltd, Calpine installed a proof-of-concept application into one of its Hermiston (Ore) combined-cycle generators. The sensing fiber was installed on top of the stator wedges (Fig A4), though an ideal installation would be under the wedges in the base shim stock.
Once online, temperature readings from the fiberoptic line compared well against the existing RTD readings. More importantly, excellent data curves emerged which clearly demonstrated the stator zone-cooling temperature affects along the length of the fiber (Fig A5). There were some small anomalies in the data, but personnel suspected these were installation-driven variances, to be proved out in the next test case.
Overall, the results were very encouraging for developing advanced online core thermal protection, as well as for additional applications of distributed temperature sensing.
Stator windings and bus systems
-
- Stator wedge design. Edward Winegard, GE
- Aeropac rewind. Derek Hooper, BPHASE Inc
- Monitoring of endwinding vibration. Mladen Sasic, Iris Power
- Connecting-ring maintenance. Keith Campbell, MD&A
- Hot-spot detection. Jagadeesh Srirama, NV Energy
- Importance of flex-link maintenance. Dave Fischli, Duke Energy
- Preventive maintenance of bus-duct systems. Jesus Davila, RMS Energy
Stator design
Ed Winegard, GE’s principal engineer for armatures, opened his presentation by noting the high radial slot forces that must be contained in the stators of modern power generators—ranging from 10 to 110 pounds/inch of slot. Fortunately, he said, these forces are predominately downward, adding that about half the slots in a given stator retain bars for different phases, about half the same phase.
For slots with both bars in the same phase the force will be downward on both bars, he said. When the bars are for different phases, the force on the top bar will be slightly upward. Some type of compression system—top ripple springs, for example—is required to minimize bar movement and ensure it remains seated in the slot (Fig B1).
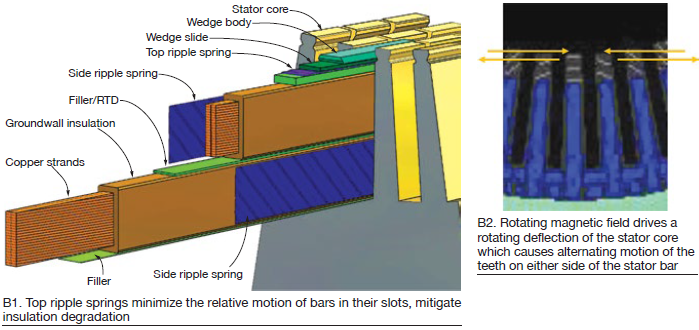
Bar lateral forces are minimal, Winegard continued. However, he pointed out the inherent tangential motion of the slot teeth caused by radial deflection of the core (Fig B2). This motion and its effect on the stator bar must be minimized. A similar method of ensuring the bar remains in contact with the slot wall is required and the side ripple spring (refer back to Fig B1) is ideally suited to meet this requirement.
There are also important stator wedging considerations which must be met, Winegard said: material properties (stiffness, creep, thermal aging, abrasion, etc), dimensions and tolerances (design clearances, tolerance stack up, component machining quality), assembly process (standard methods and sequence, compensation of assembly variation), and inspection (qualitative and quantitative validation).
Aeropac rewind
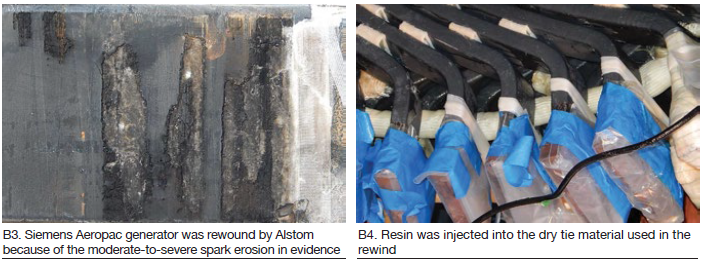
The Siemens Aeropac generator discussed by Derek Hooper, president of BPHASE Inc, a small repair, inspection, and consulting company specializing in gas-turbine generators, was rewound by Alstom in 2014 because of moderate-to-severe spark erosion (Fig B3). Numerous concerns were experienced with this rewind, including the following: injection of clear resin into the dry tie material used made it difficult to determine if the cord was fully saturated (Fig B4), difficulty in obtaining proper series connection alignment (Fig B5), and use of semiconductive packing in the phase-break gaps to attenuate partial-discharge damage.
Two years later, BPHASE performed a minor inspection of the Alstom rewind. Focus was on visual inspection of the winding and evaluation of the core keybars. The keybars were intact and within torque specifications (Fig B6). While there was no evidence of keybar fracture in this unit, sister machines had suffered such fractures and plant personnel elected to reduce the keybar torque from 300 to 200 ft-lb.
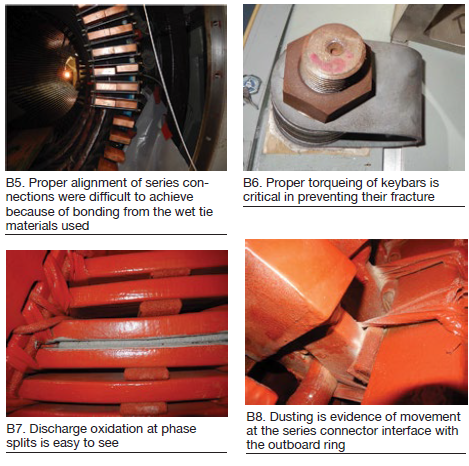
There was visible evidence of discharge oxidation at the phase splits (Fig B7). There was also significant evidence of movement at the series-connector interface with the outboard ring (Fig B8).
Because of vibration concerns, it was felt that blocking should be installed between the series connections for additional support. However, this would require bump testing. The outage was too short to allow necessary disassembly and the decision was made to install series blocking in short groups to limit any effect on the global modes of the baskets.
Monitoring of endwinding vibration
Iris Power’s Mladen Sasic discussed monitoring of endwinding vibration. Although the problems associated with movement of endwindings are not new, because of changes in the design and operation of generators these issues have become a greater concern in recent years.
The endwinding region of large turbine/generator stator windings is one of the most complex parts of a generator relative to design, manufacturing, and maintenance. During normal operation, the endwindings are subject to high mechanical forces at twice power frequency because of currents in the stator bars, as well as mechanical forces transmitted via the core and bearings at rotational speed. Furthermore, during power system transients, the forces in the endwinding can reach 100 times higher than that of normal operation.
The design of the endwinding also must account for thermally induced axial expansion and contraction as the generator is loaded and unloaded. Metallic components to restrain the movement of stator bars caused by these forces normally are avoided because of the presence of high magnetic and electric fields.
Sasic shared his knowledge on the installation of vibration sensors, offline test results, and online monitoring data from a 288-MVA, 21-kV, air-cooled generator. Offline impact test data led to installation of fibreoptic endwinding vibration sensors. Continuous online monitoring of these sensors revealed an increase in vibration level, encouraging a visual inspection and bump test of the endwinding. The inspection/test confirmed loosening of endwinding support structure. Timely corrective maintenance was then possible to prevent a costly in-service failure.
Connection-ring inspection and repairs
Inspections of connection rings typically are focused on the physical support structure-to-ring interface. While there are other factors to consider—such as the connections to bars or coils and inner cooling circuity—they aren’t as common an issue and should become apparent through other testing, MD&A Generator Specialist Keith Campbell told GUG attendees.
Thorough visual inspection is vital to an accurate assessment of the overall condition of the rings. The 10 photos here illustrate typical problems associated with undesirable movement. To begin, the ties in Fig B9 offer indications of two previous repairs using a weeping epoxy. While oil intrusion was a contributing factor, the contamination (greasing) was removed well enough to allow for an adequate repair.
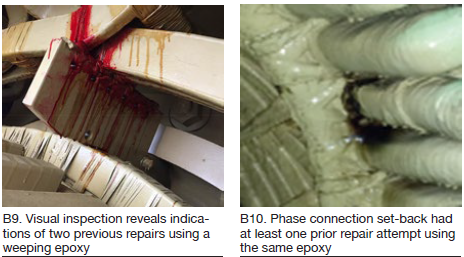
Fig B10 is of a phase-connection setback that had at least one prior repair attempt using the same epoxy. In this case, the contamination was under the ties and blocking, and could not be removed by cleaning alone. Fig B11 reflects an overall looseness in the endwinding structure as indicated by the large amount of greasing throughout. This was conducive to the possibility of a catastrophic failure. Fig B12 is of an original blocking and tie arrangement that does not meet quality standards.
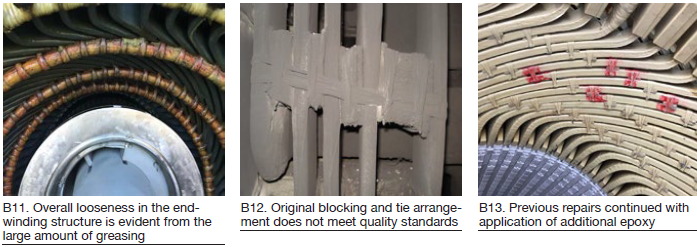
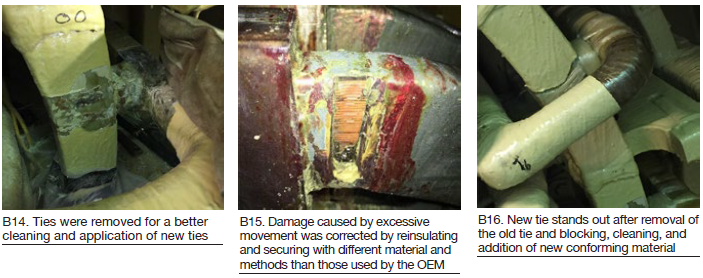
Fig B13 shows a continuation of the previous repairs by additional application of epoxy. Fig B14 reveals ties removed for a better cleaning and application of new ties. Fig B15 is the result of excessive movement that dictated reinsulating and securing of components with a different material and by different methods than used by the OEM.
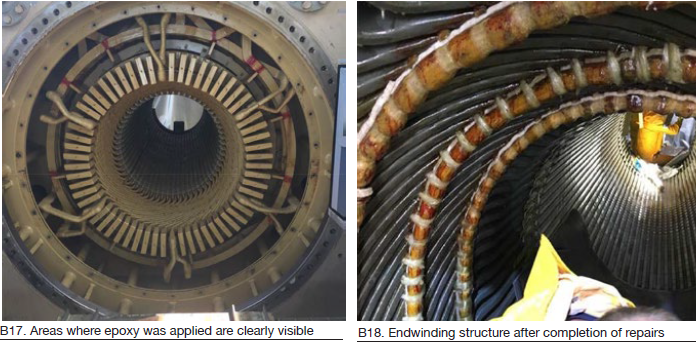
Repairs complete, Fig B16 shows the new tie after the old tie and blocking had been removed, cleaned, and new conforming material had been added. Fig B17 illustrates the areas where epoxy was applied; the Fig B18 photo was taken after repairs to the endwinding structure were completed.
Hot-spot detection
NV Energy’s Jagadeesh Srirama, a member of the GUG steering committee, profiled for attendees the recent inspection of a 391-MVA Alstom steam turbine/generator for an F-class combined cycle. This unit was put in service in 2004 and high vibrations had been recorded since installation. No issues were identified during a MAGIC (Miniature Air Gap Inspection Crawler) inspection done in 2013 and all the electrical test results were acceptable during this outage.
The unit was inspected again during a 2017 outage for simultaneous gas turbine, exhaust structure, and generator work. MAGIC identified four hot spots in the core iron and ELCID testing confirmed damage at those locations with exceptionally high readings of 1998, 1363, 674, and 976 mA. In addition to the hot spots, foreign material was found in the air gap. Management decided on immediate corrective action. To address the hot spots, it was necessary to remove the field—a challenge at this outdoor plant with major plant repairs already underway.
After rotor was removed, visual inspection identified several spots with obvious overheating similar to that in Fig B19; the debris was identified as core lamination material (Fig B20). Near the endwindings, some of the side packing had come loose and was migrating upwards into the air gap (Fig B21).
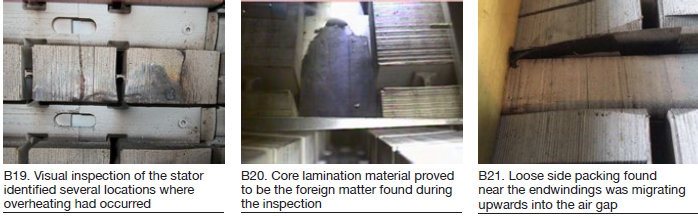
The lamination pieces came from a grossly loose tooth package, photographed in Fig B22. This tooth area was cleaned, inspected, and trimmed to make sure no more of the punchings would liberate. Mica then was placed in the shorted area and a tapered wedge inserted into the tooth to tighten the package. This wedge was epoxied in place. Note that the core step iron will have to be replaced when the stator is rewound in the future.
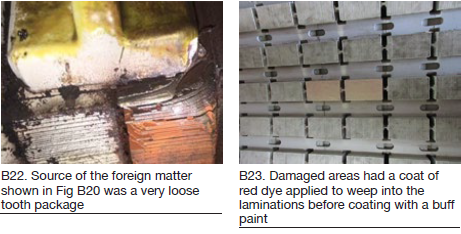
The side packing that came up from the top of the bar (refer back to Fig B21) was removed, air dry varnish applied, and new side packing installed. All damaged areas had a coat of red dye applied to weep into the laminations before coating with buff paint (Fig B23).
Importance of flex link maintenance
Duke Energy’s Dave Fischli, manager of generator engineering, and vice chairman of the GUG steering committee, reviewed for attendees the case history of a Westinghouse 818-MVA, 20-kV generator (COD 1981) that tripped on an A-phase neutral ground only a couple of months before the meeting. The machine’s field and stator had been rewound by Alstom in 2005.
Subsequent to the trip, a fire was reported at the lead box on the generator; site emergency responders used ABC dry chemical to extinguish the fire as the unit coasted down. External visual review showed significant damage to the A-phase lead area, with heat damage to the B-phase bushing area. Post-event data review showed some electrical anomalies starting eight minutes before trip.
Inspection revealed significant damage to the A-phase links; none of the 32 links remained intact (Fig B24). B- and C-phase links all were connected and appeared fine (Fig B25). There was a heavy layer of soot on the CTs for both the A and B phases, plus contamination at the bottom of lead box from fire-damaged components (Fig B26).
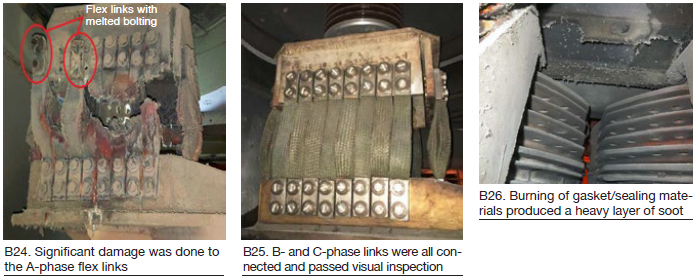
Investigators concluded that loose connections on one or more flex links caused a high-resistance contact which allowed current to flow through the bolt rather than the link contact surface area, and the bolt melted. Thus, loss of one flex link shifted its current to the remaining flex links, adding heat to them and amplifying the loose-connection problems and degraded condition of other flex links.
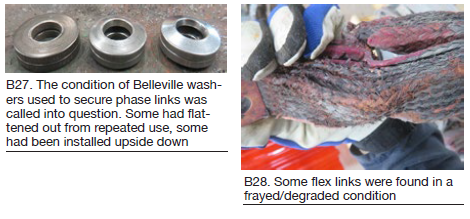
The A-phase links were too heavily damaged to record torques, but torque checks performed when removing links from the B and C phases were satisfactory. Some Belleville washers removed from the B and C phases had been flattened out from repeated use, others had been installed upside down (Fig B27). Flex links from the B and C phases also revealed fraying and degradation (Fig B28). It was evident that previous visual inspections had not been sufficiently rigorous to identify degraded links for replacement.
Consequential damage. The ABC dry powder extinguishing agents include chemicals such as sodium bicarbonate, potassium bicarbonate, ammonium sulfate, and ammonium phosphate. These chemicals act as a desiccant, absorbing moisture, and under humid conditions become conductive. They are alkaline in nature and corrosive to electrical insulation and metal components within the generator.
There was extensive contamination of the lead box and exciter internals by soot and smoke particles. Basic cleaning was performed of all accessible areas without complete disassembly. Follow-up inspection and full cleaning is planned for a 2018 outage.
Lessons learned:
-
- Ensure work-order instructions are written correctly.
- Ensure craft technicians are trained on the importance of assembling high-current connections properly.
- Ensure flex links are completely removed for electrical isolation—not just unbolted on one end and bent back out of the way.
- Ensure fire extinguishers staged around generator and other electrical equipment are CO2 or Halon (not ABC chemical).
Preventive maintenance of bus duct systems important
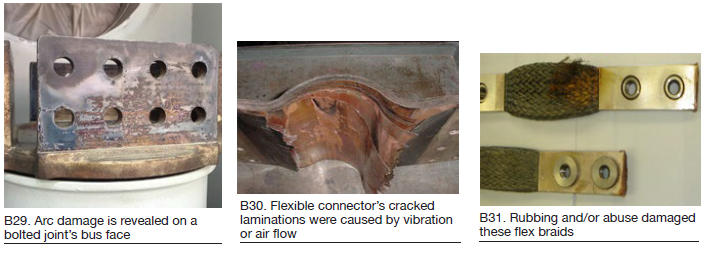
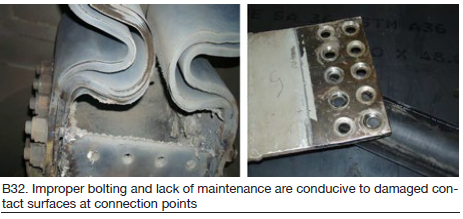
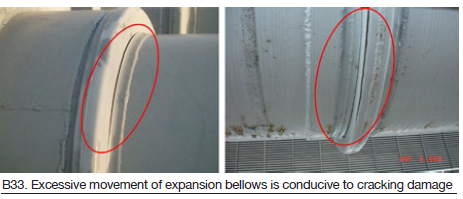
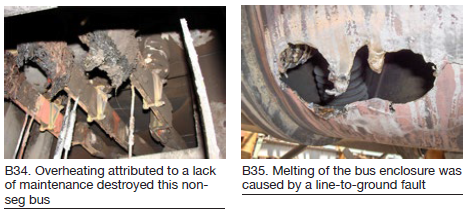
RMS Energy’s Jesus Davila reviewed for attendees the several types of bus systems and components: cable bus, non-segregated and isolated-phase bus, terminations and disconnect links, insulating materials, expansion joints, seal-off bushings, etc. Each of these requires special maintenance. Critical items on the bus duct include flex/bolted connections (current carrying), expansion bellows/joints, insulators and mountings, seal-off bushings, groundings, and insulated joints. Examples of some of the issues discussed by Davila were the following:
-
- Electrical connections. Arc damage to bolted joint bus face (Fig B29).
- Flexible connectors. Cracked laminations caused by vibration or air flow (Fig B30); flex braids damaged by rubbing and/or abuse (Fig B31).
- Improper bolting or lack of maintenance at connection points. Damaged contact surfaces and gross heating issues (Fig B32).
-
- Expansion-bellows damage attributed to excessive movement often resulting in cracks (Fig B33).
-
- Bus failures. Overheating of non-segregated bus attributed to a lack of maintenance (Fig B34); line-to-ground fault causing melting of the bus enclosure (Fig B35).
Most of the deterioration conditions listed above can be detected, particularly in advanced stages, by visual examination and/or temperature monitoring. All require immediate attention to prevent major equipment failure. If the condition is found before failure, refurbishment usually can be accomplished by obvious and/or well-established procedures.