Barney Davis Energy Center, a 670-MW, 2 × 1 combined cycle in Corpus Christi, Tex, is owned by Talen Energy and operated by Consolidated Asset Management Services (CAMS). Plant manager is Gary Clark.
Multiple benefits accrue from gas-chromatograph install
Challenge: Getting accurate gas-quality data to provide real-time gas-flow readings in Btu. Prior to installing the gas chromatograph, plant would have to wait until the end of the month to get a report from the gas supplier. In addition, staff was having to send out a gas sample monthly for analysis to get the gas composition data need to comply with air permit requirements.
Solution. Install a gas chromatograph and integrate it with the plant’s gas-flow transmitters and CEMS.
Results. Once the chromatograph was installed and integrated with the DCS and CEMS, Barney Davis was able to verify its gas supplier’s flow data and provide the CEMS with real-time gas composition data to satisfy air-permit requirements and eliminate having to wait for an end-of-month gas report and gas sample analysis.
Plus, by using this information together with market data received from our QSE we can calculate and analyze the combined cycle’s economic performance on a real-time basis. Plant personnel also are able to better analyze the performance of each gas turbine and the duct-burner performance for each HRSG.
One of the unexpected benefits was the increase in interest by control-room operators in plant efficiency. Now able to see, in real time, the cost of producing a megawatt-hour, they are more interested in reducing operating costs.
Project participant: Robert Lee Garza, operations manager

Green Country Energy is an 801-MW facility in Jenks, Okla, equipped with three 1 × 1 combined-cycle units. It is owned by J-Power USA and operated by NAES Corp. Plant manager is Danny Parish.
Complex underground water leak repairs
Challenge. Safety is one of Green Country Energy’s (GCE) core values. Occasionally, a job like the one described here, challenges the balance among safety, cost, and production.
The details: Operations identified a wet location between the steam-turbine building and the HRSG on Unit 3. This area is filled with gravel, so it was not too alarming at first. Some of the gravel was removed to see if we could find the general location of the leak. It seemed no matter where we looked, the leak appeared to be coming from that location.
Tests suggested the water was most likely coming from a breach in the circ-water piping located in that general area. P&IDs were reviewed and an excavation contractor was called to the site. Safety processes were reviewed and digging commenced. It appeared that the leak was somewhere on a line located directly under a major HRSG support platform. How to access the leak and repair the line in such a difficult location was a perplexing challenge.
Solution. Lone Star Hydrovac Co was hired to do the excavation. Its high-pressure water-jet system and high-vacuum truck made removal of the compacted gravel and fill a snap. The biggest attribute of this system was its inherent safety; no employee had to enter the area being excavated under the HRSG support pad. After excavating a small distance under the pad, Eden Structural Engineering installed a set of support pillars and jack stands to support the pad and the HRSG.
Then Lone Star removed the final material to reach the leaking pipe. The water was coming from a dime-size hole in a weld, probably caused by damage to the protective pipe coating during plant construction in 2002. The weld repair was made, the area backfilled, and the circ-water system returned to service.
Results. The leak was found and repaired quickly and effectively, and in a manner that was safe for all involved.
Project participants: All GCE O&M personnel were involved, with special recognition to Scott Helt and Thomas Hedge for leading the project.
Eliminating chemical-tote handling hazards
Challenge. A containment berm around Green Country’s chemical storage building complicated forklift entry. The nominal 4-in. sharp drop after crossing over the berm could possibly compromise safe entry. Staff re-engineered the entry, changing the sharp drop to a long gradual rise then gradual drop. Forklift operators liked the modification and management checked off one more safety improvement.
The saying “no good deed goes unpunished” applies here. Soon after the building entry was modified, a forklift operator penetrated one of the chemical totes with the forks. An RCA determined the employee was traveling too fast and the building was not arranged properly. Appropriate corrections were made.
Less than three months later, there was another forklift/tote puncture incident. Staff revisited the RCA process to identify the root cause of the new incident. The first thing noted was that after the berm was modified, there was an opportunity for the forklift to move into the building faster.
Also, it was apparent that the forks stuck out beyond the totes. Low visibility in the building increased the potential for future similar incidents. An exhaustive brainstorming session raised this question, “Why are we handling the same tote so many times?”
Solution. When the two forklift incidents occurred, a single chemical tote was being handled five or more times from delivery to empty. When a tote was delivered to the site, an employee would unload it from the delivery truck and place it in the chemical storage building. A day or so later, an operator would move the tote from the building, transfer about half of its contents into the bulk tank, and return it to the storage building. A week later, the tote would be retrieved and emptied into the bulk tank. A replacement then was ordered and the process described repeated.
The goal was to reduce tote handling to one single point-to-point process. Having a tote delivered directly from the truck to the location of use was the idea. This recommendation did not eliminate the hazard completely, but it mathematically reduced the likelihood of a recurrence, by 75% or more, and offered the benefit of eliminating the need to transfer chemicals.
Several options could make this possible: (1) plant could purchase larger bulk tanks; (2) pay a premium for smaller bulk deliveries; (3) modify the chemical building to incorporate a two-tank system with a staggered level design that would allow the portable tote to be placed in service with the bulk tank (Fig 1).
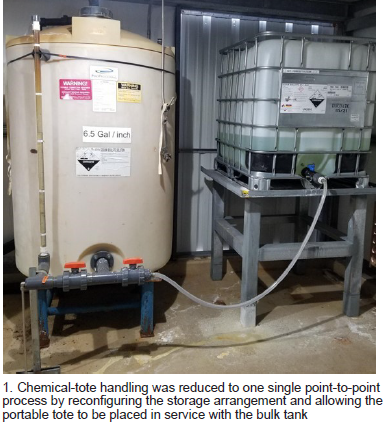
The third option was selected. It works this way: As the level of chemical decreases, the portable tote becomes empty about seven to 10 days before the bulk tank runs out. This allows a replacement tote to be ordered and delivered directly to the staggered level design rack, thus creating a point-to-point delivery process.
Results. GCE personnel have implemented several safety-improvement processes—such as use of “spotters,” improved signage for specific tote locations, and guidelines on how close two totes can be placed in front of each other. Equally or more valuable, staff took time to review the plant’s cultural process for handling chemical totes.
By implementing a simple process change, totes are handled far less often, fewer people interact with the delivery process, and the plant saves about two to four man-hours weekly from eliminating tote transfers.
Project participants: All GCEO&M personnel, with special recognition to Scott Helt for leading the project.

Armstrong Energy, a 625-MW, dual-fuel, simple-cycle peaking facility in Shelocta, Pa, is equipped with four 7FA.03 gas turbines. It is owned by LS Power and operated by IHI Power Services Corp. Brent Yatman is the plant manager.
Unit axial vibration monitoring
Challenge. Plant personnel desired a method for monitoring axial vibration levels during all phases of operation and for recording the results in the site’s plant information (PI) system. With known thrust-bearing issues in the fleet, as indicated on the 7F Users Group forum, the site was determined to closely monitor vibration to prevent abnormal wear and mechanical stress on unit components.
Armstrong relies on a Bently Nevada 3500 panel with two axial probes mounted on T1 and T2 turbine tilting-pad journal bearings and two radial probes mounted on both of the generator’s elliptical journal bearings. There are also two thrust position probes mounted on T1 and one keyphasor probe on the speed pickup wheel.
Solution. Plant personnel installed jumper wires from the thrust-position inputs to spare channels on the same Bently Nevada 40M monitor card. This enables simultaneous monitoring of axial vibration and rotor position without installing an additional probe or probes. Jumping the input signal did not affect the gap voltage; therefore, plant personnel felt confident this configuration would be successful.
The additional inputs were connected to radial vibration channels and associated with the keyphasor input to provide 1× and 2× vibration levels. By programming the inputs in this fashion, it became a simple procedure to route these signals into the Mark VI Speedtronic panels for display on the HMI.
Alert and alarm levels were arbitrarily set as identical to previously installed components because there was no guidance on these levels.
Results. Now that the plant had readings available on the HMI, it was time to verify them. This was accomplished by performing a rotor-position test (bump test). The rotor was pushed against the inactive face on the thrust bearing using hydraulic rams and jacks and a dial indicator was mounted on T1 bearing housing and set to zero.
The rotor was then forced against the active face and the dial-indicator reading was compared to thrust-position reading both at the Bently panel and on the HMI. The bump test was performed three times with repeatable results.
Additionally, each time the rotor was forced against a thrust-bearing element, hydraulic pressure was raised to 5000 psig and then lowered to 2500 psig in accordance with the OEM’s methodology. With three sets of repeatable results identical to the readout of the thrust probe at the panel and on the HMI, the site was assured that there was no issue with their set up.
The units then were operated, and vibration and position levels observed. Again, there were no issues with readings when compared against prior levels.
Plant personnel, guided by Peter Margliotti, next added the new point to the PI system and can now view both real-time axial vibrations and trend levels over time to identify possible issues before catastrophic failure.
Large-scale battery energy storage systems (BESS) continue to demonstrate their ability to meet specific functional requirements of grid operations and management under a variety of business models and ambient conditions. Los Angeles Department of Water and Power (Ladwp) is the latest to add a BESS, primarily for transmission-line stability. It follows several recent projects with distinctly different primary functions.
Two years ago, Southern California Edison added a large BESS to its Center Peaker Facility. Its primary function is to capitalize on pricing for spinning-reserve capacity in the CAISO market. While the gas turbine/generator proceeds through its start sequence, the BESS delivers power immediately. The BESS also takes load swings while the turbine operates at maximum output, its most efficient and lowest emissions operating point.
SCE is credited with pioneering the first application of a fully integrated, hybrid BESS/LM6000 peaking facility. Just before that project began operating, the Village of Minster (Ohio) brought a 4.2-MW solar PV facility online paired with a 7-MW/3-MHh BESS primarily for power-factor control, peak-load management, and Reg D frequency regulation in the PJM market. Minster purchases all of these “services” and owns none of the equipment.
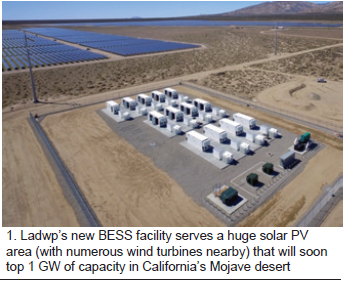
T-line stability. Last October, Ladwp brought a 20 MW/10 MWh BESS online down the road from a substation which takes 34.5 kV power, collected from 570 MW of solar PV in the area, and converts it to 230 kV for a long transmission line that takes the power to LA (Fig 1). The Beacon Solar + BESS earned recognition from the American Society of Civil Engineers (ASCE) as an Outstanding Energy Project.
Unlike Center and Minster, the primary function of the Beacon BESS is T-line frequency control and voltage regulation, with a secondary purpose of load following during the daily transition late in the day from sunlight to dusk as the utility’s afternoon peak demand begins to ramp up.
According to Ladwp’s Tom Honles, power engineering manager, in its first six months of operation, the BESS has successfully demonstrated its daily load-following function from 6 pm to 8 pm, discharging from a full state of charge to minimum state of charge at a programmed ramp rate of 5 MWh per hour. If necessary, the utility’s control center can dispatch the full 10 MWh of energy in a half hour or less.
Perhaps as importantly, the BESS has been shown to accommodate the extreme weather variations in the area, having operated through both sub-freezing and 120F ambient temperatures. The Mojave is among the harshest climates, in terms of extremes, in the continental US.
Utility grade. Experienced utility engineers will recognize a “utility mentality” in the design of this BESS. For example, there are redundant battery stacks to allow for scheduled maintenance outages and lifecycle cell degradation. While the plant requires 12 containerized battery units to meet rated load, a thirteenth was added for reliability and redundancy. Each container also includes redundant air conditioning systems; two HVAC fans are visible on each end (Fig 2). Each cooling system is “alarmed” as well.

Battery thermal management is always critical for a BESS but in the desert, even more so. To ensure that those a/c systems operate in the event of a complete loss of grid power in the area, a Cummins 180-kW (200-kW standby) turbocharged diesel/generator was incorporated into facility design. Seven days of fuel onsite is available to keep the containers cool (Fig 3). The engine was sized based on the a/c load, which gives you an idea of the parasitic load taken for thermal management.
The battery control system is integrated into the complex of battery enclosures, with redundant failover intelligent controllers, while the operator console and system protection reside at the substation control house about a half mile down the road. The ac substation also has seven-day backup engine/generator capability to support both the solar array and energy storage.
On top of the physical design margin, Ladwp has a contractual performance guarantee with Doosan Gridtech and KTY Engineering, the BESS supplier and facility engineer, respectively. The utility performed site acquisition and development, grading, electrical interconnection, structural foundations, site security, and control integration into the Scada network and Ladwp’s Energy Control Center (ECC).
Samsung SDI supplied the lithium-ion batteries/inverters. Fire protection is integrated into each box. The inverters are designed to meet PRC24 code for low-voltage ride-through.
Temperature has such a huge impact on batteries that, according to Honles, the components had to be sequenced and shipped to the site to minimize ground storage time. Otherwise, it could affect lifecycle performance.
As another precaution, the entire site is electrically grounded, since Li-ion batteries are “always hot,” says Honles.
A thousand words. A picture of the area offers a glimpse into what Ladwp has to manage but a visit puts it in stark terms. One sees on the drive up to the facility endless wind turbine/generators as you get within 10-15 miles of Beacon. Then when you take the turn off the main highway into the Ladwp grounds, it’s nothing but endless solar PV arrays. Honles notes that in a few years, more than a gigawatt of solar PV will be operating in the vicinity of the BESS.
Clearly, it is a remote location, but the BESS isn’t expected to need much attention. O&M procedures include maintenance of the critical cooling systems for the containers; replacement of a/c filters, something most homeowners can relate to; and semi-annual battery inspections.
Startup issues focused mostly on the power converter systems (PCS) and the battery controllers, but were of the typical mean-time-between-failures (MTBF) bathtub curve variety, notes Honles, and were experienced in the first three weeks of contractually stipulated performance testing, prior to declaring acceptance into commercial operation.
The BESS went through extensive testing in all three performance modes (frequency control, voltage control, peak-power delivery) prior to acceptance. Each battery rack had to do one full charge/discharge cycle each day for 90 days and do this 95% of the time (95% reliability guarantee, 99% availability).
Software allows three selectable operating modes. Frequency control has priority most of the day. At 6 pm, the software automatically switches into discharge cycle, and empties 100% each day from maximum state of charge (SOC) to minimum SOC. The final mode is to soften the solar ramp out at the end of the day as the sun goes down. The BESS was exercised in all of these modes during the performance tests.
The controls and communications architecture is often the greatest challenge with a large-scale BESS. Each battery cell has to be monitored and managed with tens of thousands of others, a task relegated to the battery supplier and its optimized battery controller electronics.
Then the battery system has to be integrated with the dc/ac PCS and inverters. The PCS’s ac connection is matched with corresponding harmonic-rated ac step-up transformers to match the medium voltage of the plant. The BESS may be integrated with a solar PV plant, such as that at Beacon, and through a utility substation, stepped up to a high voltage and interconnected to the transmission system. Entire facility requires control and communication with the utility Scada system.
To handle all this, Ladwp specified an open standard, and accepted in the system integrator’s proposal, the Modular Energy Storage Architecture (MESA), a communications protocol which, says Honles, includes a wide set of available data points, and flexibility with other storage configurations. While MESA was developed primarily for distributed energy resources, Ladwp adapted it to its needs by adopting a reduced set of data points necessary for the utility-type operations of their ECC.
Commercial terms. The BESS and balance of plant cost $17.5-million, almost $2-million less than the not-to-exceed authorization from the Ladwp Board. Total cost, including site development and interconnection, was around $23-million. However, it is important to note that the project was driven by the state’s AB2514 storage mandate, not an investment-grade payback, and to demonstrate the ability to serve as a reliability-enhancement asset.
Regarding the latter, Honles notes, the other options would have been (1) a static VAR compensator or (2) load shedding and curtailment of solar capacity on the transmission line. Neither would have provided a peak demand solution, however.
Storage in context. Finally, while this facility is large in the scheme of evolving grid-scale storage, it is worth noting that it is minuscule compared to the “big daddy” of storage in Ladwp’s system, the nominal 1300-MW Castaic pumped-storage hydroelectric plant. In this context, BESS has a ways to go. In fact, some power-system engineers estimate that 250 MW of variable generation ultimately needs to be coupled to 100 MW of 4-hr-capable storage to truly provide grid stability.
By Jason Makansi, principal, Pearl Street, a Tucson-based consultancy
All of us can point to truly memorable events and periods in our careers. A 10-day period that began with a tour and deep dive of Los Angeles Department of Water & Power’s (Ladwp) Beacon storage facility in the Mojave desert and ended with the catastrophic fire and explosion at Arizona Public Service Co’s (APS) McMicken storage facility, Surprise, Ariz, certainly qualifies. Within those two endpoints was attendance at Electric Power Research Institute’s (EPRI) Energy Storage Integration Council (ESIC) meeting and the Energy Storage Association’s (ESA) Annual Conference, both in Phoenix.
The week was a technology-development roller coaster. First, on Thursday (Apr 11, 2019), was the “high” of the 20 MW/10 MWh Ladwp facility essentially meeting all of its performance expectations in the first six months of operation. The ESIC meeting the following Monday tempered things, as one might expect, as utility engineers and vendors vigorously investigated technical challenges, standards, performance definitions, reliability goals, and life-cycle aspects of grid-scale storage.
This was followed by the unbridled optimism of the ESA conference and expo, where one rep of a prominent storage system vendor noted privately, “We’re now responding to quality grid-scale RFPs and RFQs every day.” At the opening keynote session, ESA representatives proclaimed their vision as 35,000 MW of storage by 2025, certainly a “stretch” goal based on the reported 770 MWh of grid-connected storage installed in 2018.
Inadvertently well-timed was ESA’s announcement of its Industry Corporate Responsibility Initiative (CRI) to establish best practices in lifecycle, safety, and end-of-life decisions.
By Friday, the first accounts of the 2-MW/2-MWh battery facility catastrophic event at APS’ McMicken substation were in the papers.
The path to commercializing and scaling-up a wholesale new electricity grid asset class is never linear. Another memorable career period was when advanced F-class gas turbines were being air-lifted from around the world in the early to mid 1990s to repair catastrophic failures and address design flaws. In the history books, you’ll find the painful and deadly period of boiler explosions in the early part of the last century.
Challenges abound. While there’s always healthy tension between the marketing and promotion in a sector and the more sobering engineering, operations, and maintenance activities, the ESIC and the ESA meetings were back-to-back days of contrast. The following broad challenge areas below discussed at ESIC make the stretch goal of 35 GW by 2025 ambitious, especially considering the APS event and other incidents which have come to light since then.
Parasitic power. Long-time residents of the desert Southwest are fond of saying air conditioning (a/c) isn’t just a necessity, it’s life support. Apparently, that’s true of battery enclosures, too. The backup engine generators at the Beacon facility, for example, are sized based on cooling the battery enclosures for up to seven days if site power is lost. One attendee at the ESIC noted that the a/c has to be running whether the batteries are operating or not.
Parasitic power consumption can be a hit on projects planned for a low total operating hours.
Other sub-topics which arose were electricity rates for charging batteries (wholesale, retail), how charging power is metered (separate circuit?), and what the impacts will be on the Investment Tax Credit.
State of Charge (SOC). This essential battery performance parameter continues to be a source of much confusion. SOC is a measure of the battery’s available capacity, reported as a percentage of the battery’s rated capacity. Overcharging or over-discharging a battery affects the internal cell structure.
Improperly managing the SOC impacts performance, especially degradation of the cells over time and safety. One owner/operator noted that the definition of SOC is not consistent across vendors. Also, it’s not an open standard, and the battery control schemes to manage SOC, critical to overall performance, are proprietary.
Every charge/discharge cycle imposes a cost on the system, another stated, who then asked, “Do you restore the SOC quickly or slowly, and when, at night when electric rates are low?” There was a high degree of consensus that ESIC should focus on degradation rates for warranty claims. The degradation sub-model in the performance model EPRI is building has to be robust, because “vendors say you have to run the battery in exactly the mode specified for the degradation warranty to be valid.” An attendee observed, “SOC is not a measured data point, but instead a vendor estimate.”
Degradation test methods, models, and metrics received the highest rating and endorsements for ESIC’s work product deliverables.
Safety. Codes and standards were the subject of some controversy. “Safety Test Method for Evaluation Thermal Runaway Fire Propagation in Battery Energy Storage Systems” (UL 9540A), derived from work in New York City and being adopted by California, is the applicable code for fire protection, but still a work in progress, according to attendees.
Another standard discussed was NFPA 855, “Standard for the Installation of Stationary Energy Storage Systems.” At least one vendor claimed that meeting UL 9540A and NFPA 855 is “expensive and logistically difficult” because to get the right data, you have to deliberately induce a thermal runaway to see what happens.
When considering safety, one has to think in terms of four levels—battery cell, module, unit, and complete installation. At the module level, one design recommendation is that there be 3 ft between the enclosure wall and each 250-kW module, unless the battery is confirmed to pass the safety test.
Little information on cause has been reported out of APS on McMicken, but one source at the meeting noted that power electronics were the source of at least two high profile battery fires. Improper grounding has also led to fires.
Performance. Basic definitions, like efficiency, are not well defined. Storage advocates key in on “benefits stacking” for economic evaluations, essentially monetizing the various functions a battery facility can accommodate—such as transmission-line voltage stability, frequency control, peaking-power supply, taking power out of the grid (charging), short-term discharge, long-term discharge, black start, and other ancillary services.
Unfortunately, designing the control system to handle all of these functions is complicated, impacts on warranties can be severe, performance metrics for each function are ambiguous, and accurate forecasting of such things as weather and loads is required. The fact is, performance and reliability standards for grid-scale storage are just now being formulated.
ESIC is now incorporating reliability into the generic storage model (called StorageVET) it is developing for the industry. Plus, users note the model needs to be adjusted to reflect the constraints in different ISO regions. Currently, it is described as “very California-centric.”
Other issues which came up include the following:
-
- Vendor difficulties with utility interconnection requirements and compatibility with utility SCADA systems.
- Commercial inverter products designed for solar PV, not batteries.
- Clear upfront costs of facilities, unclear lifecycle and O&M costs (failure rates, battery degradation, end-of-life recycling).
- Compliance with cybersecurity rules, division of responsibilities, and enforcement mechanisms (a white paper is available), especially when vendors need regular access for maintenance and control-related activities. Incorporating firmware upgrades in cybersecurity compliance was identified as a key issue.
- Defining availability, a big factor in procurement, especially when a utility needs to standardize across 20-30 projects (according to one attendee).
To learn more about industry efforts to standardize on some of these performance issues, consider reviewing IEEE 1547-2018, “Standard for Interconnection and Interoperability of Distributed Energy Resources with Associated Electric Power System Interfaces,” which includes energy storage as a DER.
ESA activities. Being DC-based, ESA officials discussed in the keynote session FERC Order 841, which removes barriers to storage (in wholesale markets, which FERC has jurisdiction over); House of Representatives Bill 2096 (Energy Storage Tax Incentive and Deployment Act) which offers to stand-alone storage projects the same investment tax credit (ITC) benefits (30% tax credit) enjoyed by solar; storage procurement targets now issued in several states; the “clean peak” standard in Massachusetts, and expanding state integrated resource plans (IRP) to include storage.
In light of McMicken, the Corporate Responsibility Initiative undoubtedly has risen in priority. According to info at the ESA website, signatories to the initiative pledge to “engage in a good faith effort to optimize performance, minimize risk, and serve as an exemplary corporate citizen in the manufacturing, deployment, implementation, and operation of energy-storage projects across the US.”
Best practices are being established by an inaugural task force in the areas of potential operational hazards, end of life and recycling, and responsible supply-chain practices.
Catastrophic events. According to press accounts, eight firefighters were injured, four hospitalized, by the explosion which occurred at McMicken after they had arrived and begun to fight the fire. All APS has said about the event, pending the results of an investigation, is that the facility experienced an equipment failure. It is important to acknowledge that the equipment could have been the battery, inverter/power electronics, or balance-of-plant components.
Press accounts have also noted that Korea has experienced 21 fires at lithium-ion battery facilities; incidents in China with electric busses, and in this country with Tesla electric vehicles, have gone unreported, or underreported.
APS also experienced a fire with an earlier, smaller storage demonstration project in 2013. Based on public statements, the utility’s executives are undeterred in their pursuit of 850 MW of grid-scale storage by 2025.
Fluence, the joint venture between AES Energy Storage LLC and Siemens AG, is the supplier of record for the McMicken facility. It is responsible for close to 800 MW of storage around the world; this is reported to be its first major safety incident, according to an article in Greentech Media, Apr 23, 2019.
About the author
Jason Makansi’s experience in grid-scale storage spans more than three decades. As principal of Pearl Street, an independent consulting firm, he was executive director for two separate DC-based policy organizations (2001-2004, 2009-2013) focused on grid-scale storage; was principal investigator for two private-label storage executive reports issued by other consulting firms (2015, 2013); led a reverse trade mission on grid-scale storage for the US Trade & Development Association (2016); assessed market and economic potential for two advanced storage technology concepts, one for a Fortune 500 firm (2007, 2010), one for a fuel cell supplier (2011); acted as advisor of record for a $5-million venture capital raise for an ultra-capacitor firm (2011); and evaluated US markets and applications for a Japanese Fortune 50 energy-systems supplier seeking entry for its lithium-ion battery technology (2010).
He evaluated and reported on all leading grid-scale storage technology RD&D, applications, and demonstration facilities during his 18-year tenure at Power Magazine (1981-2000). Since CCJ’s founding in 2003, his articles on storage have appeared exclusively in the COMBINED CYCLE Journal and its sister publication, GRiDToday, and CCJ-ONsite.
 Some veteran gas-turbine (GT) asset managers have already been given responsibility for grid-scale storage facilities. Others may find their asset portfolio shift in this direction soon.
If you are in this camp, or if you just want some technical guidance around this new asset class, get a copy of the Advancing Contracting in Energy Storage Working Group’s (ACES) Best Practice Guide (BPG), available online at no charge.
According to lead investigator and storage sector veteran consultant Richard Baxter, the ACES BPG was written primarily for non-technical stakeholders in storage projects—lenders, lawyers, new project developers, and others – to help them “define what it is they are being asked to participate in, ask the right questions, and evaluate and compare project opportunities.” Baxter further notes the overall objective is to “more quickly get the sector to coalesce around generally accepted practices.”
Grid-scale storage is a wholly new electricity asset class being developed primarily around exciting, but complex, new battery technologies. It’s on the cusp of rapid growth. GT veterans might liken it to the early to mid-1990s when IPP and merchant generation projects around advanced gas-turbine technology were entering the industry.
One thing’s for certain: You can’t pick up your operational practices from other less dynamic energy technology projects, warns Baxter, whether GT, solar, or wind, and impose them on battery storage. Energy storage is “more akin to a living organism” and standardized maintenance protocols will only come with far more field experience than the sector has today.
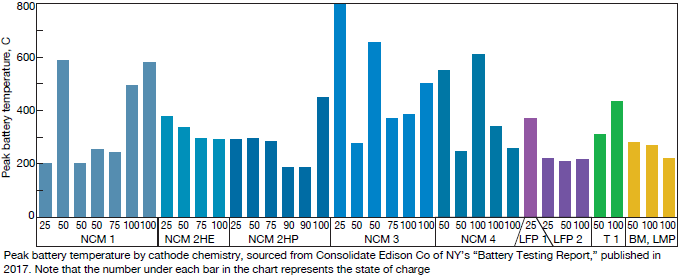
Still, GT experts will recognize some analogies to their facilities. For example, performance of lithium-ion batteries, the prevailing technology, is affected by ambient temperature. For GTs, it’s efficiency and output. Batteries, however, chemically and physically degrade; deviations from ideal operating temperature can have “severe consequences” on battery cell life (chart)—just think of your digital devices. Parasitic energy is consumed to maintain that ideal temperature within the enclosure. Assuring uniform flow of coolant around battery pack outer enclosures is essential, but a challenge.
ACES’s BPG confirms what was learned last year at storage-industry meetings: There is little consensus deriving basic grid-scale battery performance parameters—such as reliability, round- trip efficiency, and degradation rates. Safety is in the same category. The BPG quotes an earlier 2014 DOE report, “It is almost impossible to have a meaningful technical discussion about ESS [energy storage system] performance or reliability.”
While the report acknowledges there has been progress within storage communities to address these gaps, the CCJ summary from last year suggests there is still a ways to go. The Energy Storage Association’s (ESA) Corporate Responsibility Initiative also is addressing safety and reliability issues.
The 2019 conference of the Combined Cycle Users Group (CCUG) was a prime example of “working together,” co-located with the generator (GUG), steam turbine (STUG), and powerplant controls (PPCUG) user organizations. Attendees were invited to participate in sessions conducted by all four groups at the Marriott St. Louis Grand, St. Louis, Mo, August 26-29.
On Monday morning, CCUG offered an Environex Inc training session for all: “Strategies for improving SCR/CO catalyst performance and lifecycle.” Dan Ott, president, reviewed catalyst types, reaction and oxidation chemistry, dual-function configurations, ammonia system design, low-turndown performance, lifecycle testing, and ways to improve NOx compliance.
Owner/operators can view Ott’s slides, and those of the other presenters, on the Power Users website. Registration for access is simple and most worthwhile: More than a hundred presentations were made at the so-called Combined Conference.
 2020 Conference and Vendor Fair
August 31 – September 3
San Antonio Marriott Rivercenter
Meeting is co-located with the Steam Turbine, Generator, and Powerplant Controls Users Group conferences.
Contact Sheila Vashi at sheila.vashi@sv-events.net
At 1 p.m., all participants came together for introductions by Duke Energy’s Jake English, conference business manager and member of the STUG steering committee. He emphasized the founding principle of sharing information and keeping the discussions technical, not commercial.
NV Energy’s Jimmy Daghlian then presented the CCUG’s 2019 Individual Achievement Award to Consultant John Peterson, formerly with BASF and a founder of the Frame 6 Users Group, and Steve Royall of PG&E. This year’s Clyde Maughan Award went to James Timperley, EMSA Technical Services (formerly with American Electric Power Co and Doble), presented by Kent Smith of Duke Energy and past chairman of the Generator Users Group.
Keynotes
FBI Special Agents Kyle Storm and Jaret Depke presented the first of two keynotes: “Confronting cyber and counterintelligence threats from the FBI’s perspective.” Jeff Chann of GE, followed with the second: “Managing your plant over the next decade.” Chann addressed the common concern of survival in the changing market. His message: “If we don’t react, the balancing authority will go around us and find the solution.”
The tone was set for not how to thrive, but how to survive. The message: Contribute to the overall portfolio, be best in your zone, mix in, and realize that your plant’s capabilities on Day One are not what’s needed tomorrow.
Content from well over 100 presentations/discussions was shared at the 2019 Combined User Group Conference. What follows are highlights from a few of the CCUG presentations to give you a flavor of the meeting and to encourage your participation in the 2020 conference at the San Antonio (Tex) Marriott Rivercenter, August 31-September 2.
Critical valves and piping
Thick metal parts are having problems sooner than expected, largely because of repeat thermal transients (cycling). PG&E’s Tim Wisdom characterized the challenges of cycling in Fig 1.
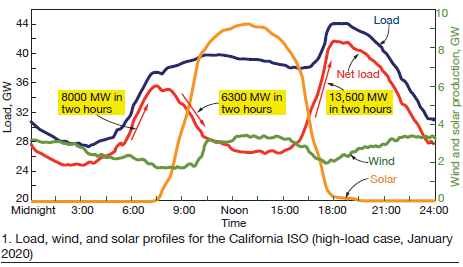
As Wisdom put it, “We are seeing damage to main-steam and hot-reheat valves, and cracking of the HP drum internal downcomer nozzles. The correlation between cyclical duty and increased owner/operator time and expense on high-energy piping (HEP) programs is becoming more apparent during every outage.”
Major valves are failing early regardless of material, including F91 (forged P91). Components thought to be reliable for 30 years “are failing at around one-third the expected life,” he cautioned.
The valves discussed suffered from delamination of hard-facing materials (stellite liberation) which is generally repairable, but also from deep-body cracking which is not. Wisdom also addressed the common issues of cracking in steam and bypass lines (Figs 2 and 3).
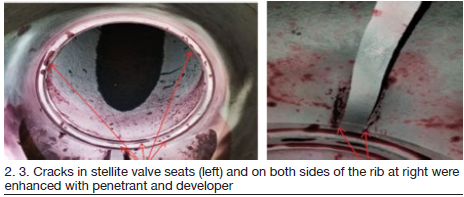
A heads-up: One site had to stop and wait for a state-authorized inspector to approve temporary repair measures for a P91 spool piece because the valve was within the code boundary of the HRSG. The ensuing discussion on the delay included a reminder of long lead times on new critical components.
So how do you prepare to cycle twice each day?
-
- Consider how you will manage added costs. Major maintenance expenses can double, and maintenance intervals can be reduced by half.
- Continue to leverage industry resources. (See what others are doing.)
- Know the lead times for replacements. “Look at things and have a plan.”
- Anticipate!
He followed with some valuable lessons learned:
-
- Ensure that you have spare critical valves and stay abreast of design improvements.
- Compile risk rankings for all critical components in your HEP program.
- Ensure that all high-energy piping is part of the risk and inspection program. (Code only recommends 4 in. and larger.)
- Eliminate risk of dissimilar metal weld failures—for example, P91 to Type 316 stainless steel.
- Ensure your main steam and HRH strainers can capture liberated materials from degraded valves.
Returning to his cycling discussion, he offered a motivating mental image: “We need to be ready at all times. We have become the light switch.”
GT performance
Award recipient Peterson discussed “Maintaining best gas turbine performance” with an informative historical review—including the increase in compression ratios for frame gas turbines over the years. The key today, he stated, is “the efficient compression of air.”
He listed the primary factors for compressor losses:
-
- Mechanical damage (foreign object impact and tip-rub contact).
- Mechanical wear of seals.
- Airfoil surface erosion, corrosion, and fouling.
- Guide-vane calibrations.
- Air and oil leaks.
Commonly used expressions for these factors are recoverable loss, unrecoverable loss, air flow loss, and compression efficiency loss.
He then reviewed various cleaning techniques including:
-
- Abrasive cleaning.
- Online washing with and without detergent.
- Offline washing (periodic cold crank wash).
- Hand cleaning of airfoils.
A case study on excessive Frame 6 fouling, and discoveries inside the filter house, led to a tangential discussion on the pros and cons of hydrophobic HEPA filters.
CUI
Aaron Berry, Puget Sound Energy (PSE), led the discussion on corrosion under insulation (CUI), a common threat to carbon steel, alloy, and 300 series stainless steel piping systems. The topic has become standard at most industry events, largely attributed to cycling and intermittent service.
High-risk areas, he explained, are feedwater systems, small bore fittings, dead legs, areas near HRSG penetration seals, and thin-wall interconnecting tubing. Mineral wool insulation, he stated, is the worst environment for CUI. Long periods of equipment layup increase risk.
PSE operates five combined cycles varying in age from eight to 25 years, in environments ranging from marine to arid.
Berry’s key message: CUI is detectable and preventable. He covered various inspection techniques including:
-
- Strip and inspect.
- Pulsed eddy current.
- Guided wave ultrasonic.
- Radiography.
“Have a long-term program, and start inspecting,” he said. “Don’t wait for failures.”
Chasing BTUs
HRST’s Jordan Bartol next went deep on how HRSGs can influence overall plant performance. “We’re chasing Btus and trying always to improve plant heat rate.”
Units built in the early 2000s are now at mid-life. Target areas for HRSG heat rate improvements are:
-
- Economizer design and operation.
- Attemperator operation.
- Fouling (increased backpressure).
- Exhaust gas bypass.
- Casing hotspots.
- Exhaust leaks.
- Steam turbine interaction reviews.
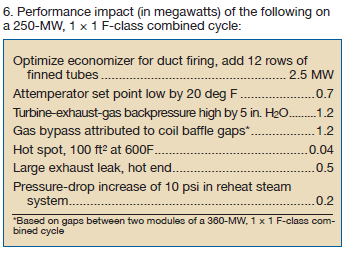
Economizer approach temperature is a critical parameter, discussed in detail. Bartol then turned to a typical three-pressure duct-fired HRSG with reheat, and the benefit of adding 12 tube rows to the HP economizer (Fig 4).
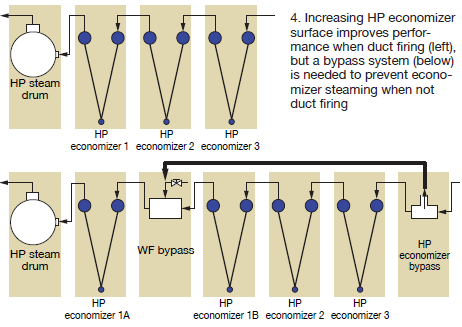
In his example, adding these rows increases steam turbine output by 2.5 MW for a 1 × 1 F-class plant with duct firing. But this also requires a bypass to prevent economizer steaming during unfired operation.
The additional surface can be included in a new HRSG if heat rate while duct firing is important. Retrofits might prove difficult because of space limitations, but the SCR duct may have room available and, if so, should be considered.
For the increasingly familiar topic of attemperation, Bartol listed some negative consequences of lowering the steam temperature set point in the control room, using, as an example, a 7FA with typical three-pressure HRSG. Such action can do more harm than good, he warned. The increased spray-water flow can damage downstream pipes and tubes, contribute impurities to steam, and decrease steam-turbine performance.
In the HRSG tube bundles, baffles reduce exhaust-gas bypass. Gaps that allow hot gas to bypass heat-transfer tubes hurt performance; even small gaps can allow significant bypass. Properly maintained gas baffles therefore become critical to good performance (Fig 5).
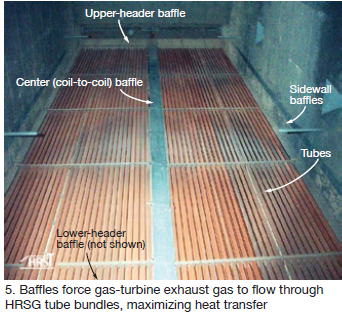
“Baffles are relatively inexpensive yet very important devices,” he said. “But they must be properly designed for thermal expansion, must be sturdy, and must be part of each inspection. Fixing a small portion can result in a large performance gain.”
Casing hotspots may have a smaller impact on performance, but can lead to cracks and have a negative impact on safety. Exhaust leaks also affect performance. Common leak causes are failing bellows, torn fabric seals, failed penetration seals, and failed expansion joints.
For steam-turbine interaction, “Watch pressure drop in the reheater section” (from exit of HP stage to entrance of IP stage). A 10-psi increase can reduce steam turbine output by 0.2 MW in the F-class example (Fig 6).
Piping damage, drain control
HRST’s Guy Thompson followed with the negative impacts of superheater, reheater, and piping drain problems and the formation of condensate, another increasingly encountered topic.
His focus was on low-point drains in the high-temperature reheaters and superheaters. During the past 15 years, emphasis has been on drain size, drain valves and automation, and operating practices to ensure condensate removal.
He then offered some rules of thumb to reduce resultant tube and header damage, generally recommending 2-in. drains for the range of pressures encountered by F-class HRSGs.
Condensers
Intek (Tim Harpster and Tony Bonina) offered case studies on distinctive instruments for monitoring steam-turbine surface condensers. Specifics focused on both early detection of performance issues and long-term monitoring for:
-
- Cooling-water flow rate.
- Vacuum equipment capacity.
- Air in-leakage detection.
- Data systems validation.
Discussions also covered:
-
- Steam pressure and temperature.
- Cooling-water inlet and outlet temperatures.
- Differential pressures across waterbox orifices.
Case studies showed specific results of RheoVac® condenser monitors, Rheotherm® flow and fouling sensors, and integration with other temperature and pressure instrumentation. Benefits included improved circulation and reduced backpressure.
SCR, AIG tuning
Jeff Bause, CEO of Groome Industrial Service Group, addressed SCR catalyst replacement and tuning of the ammonia injection grid. He first noted ongoing improvements in catalyst technology.
Case studies focused on the importance of AIG cleaning for efficiency, conversion rate, and system capacity.
One suggestion: Use a permanent sampling grid specifically designed to continually test AIG effectiveness, take samples throughout the grid (no probing), and make AIG tuning easier and more precise using detailed probe maps.
Catalyst-replacement case studies covered specific NOx conversion data, ammonia slip, and ammonia consumption comparisons before work, after work, and after tuning.
Forward-looking discussions included the increasing presence of sulfur from shale gas, the smaller size of some replacement catalysts, and use of dual-function catalysts to reduce both space and backpressure.
NERC CIP
The North American Electric Reliability Corp (NERC) Critical Infrastructure Protection (CIP) plan is a set of alerts and requirements designed to secure the assets needed for operating North America’s bulk electric system.
Frank Lyter (Talen Energy) presented a CIP update with discussion points for:
-
- Reducing risk to the bulk electric system.
- Standardizing industry processes.
- Enhancing feedback to NERC.
- Issuing timely NERC alerts.
Upcoming CIP Standards (CIP-003-7 and 8) will take effect in early 2020 to address:
1. Physical security.
2. Electronic access security.
3. CIP exceptional circumstances—for example, supply quality concerns.
4. Transient cyber assets.
Laptops and removable media included in No. 4 above are among the greatest new security challenges, he said. They are in wide use throughout each site, particularly during outages, and involve many individuals, groups, and companies. Checklists and processes initiated by Talen Energy were shown and discussed in detail.
NERC alerts also were reviewed—including concerns over Chinese supply and drones used for both security and surveillance. Alerts and bulletins provide guidance on such timely issues. In 2019, an alert was issued on drones offering this specific guidance:
-
- Purchase drone devices and components from reputable vendors.
- Understand how and where drone data are being stored.
- Determine how the drone will interact with infrastructure and networks.
- Perform detailed risk assessments.
- Implement multiple internal reviews and controls.
Multiple controls could include monthly checklists, contractor report reviews, and analysis tracking documents. Also, standardizing forms across an owner/operator fleet can streamline the review processes.
Lyter’s message: “We now need to consider vulnerabilities not normally considered.”
Amines
Calpine Corp’s Stan Avalone and Craig Cannon discussed the fast-growing topic of film-forming substances (FFS, including amines), focusing on recent company experience. Calpine’s HRSG reliability issues have been severely impacted by unscheduled layups and both single- and two-phase flow-accelerated corrosion (influenced, in part, by unit age).
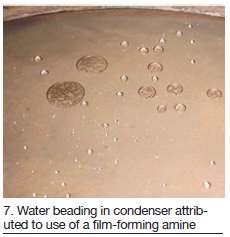 The presenters’ experience, water beading in a condenser has shown the benefit of a polyamine protective film. Once formed, in their example, the protective film remained intact even after dosage fell below the required level or was interrupted for a short period of time (Fig 7).
Nitrogen blanketing remains the industry standard for long-term layup, but layups with amines can help reduce corrosion and the potential for under-deposit corrosion in evaporator tubing. Unlike other protection methods, the presenters explained, “the FFS technique is implemented in advance of the unit outage while the equipment is still operating.”
Application methods and recommendations were outlined, along with the caution of over-feeding.
Calpine’s future plans include studying the differences in available and emerging FFS products, expansion of this chemistry to more units, and combining the feed of neutralizing and filming amines to make initiation and long-term optimization easier at each site.
Outage planning and management
Phyllis Gassert, director of asset management at Talen Energy and the CCUG 2019 chair, began by asking three fundamental yet critical questions:
1. When is the right time to start planning a major outage?
2. Who should be involved in the planning process?
3. When do you start including the contractors?
“Any outage of three weeks or more needs at least two years of planning,” stressed Gassert. “Bring your managers into the entire planning process, and put your plans in each contractor bid.”
Gassert’s presentation covered all important areas including maintenance, defining the roles of not only contractor staff but also your own, and physical site management. Beyond the many traditional items, Gassert added some interesting thoughtworthy items:
-
- When planning parking, don’t forget shift overlap (more cars).
- For parts, plan space for both incoming and outgoing (more parts).
- Prepare purchase orders and change orders in advance (to avoid interruptions, stress, and possible careless errors).
- Watch carefully for contractors’ incoming assumptions or undisclosed expectations—cranes, elevators, facilities, etc.
Go for the realistic, not the best, schedule. And remember: “Under budget and on schedule means nothing if someone gets hurt.”
Gassert was asked, “When do you implement scope freeze?” The answer: at three months out. Any deviation requires at least two authorized signatures.
Workforce and community
Dr Robert Mayfield, a former submarine commander and today plant manager of Tenaska Westmoreland Generation Station, shared some insights on life in his combined-cycle environment.
“Knowledge must be created and captured, shared, and transferred, and organized and integrated. Our biggest problem today is skill sets.”
Westmoreland is a nominal 1000-MW combined cycle with only 24 employees. Perhaps more significant, 80% of the staff has moved from a union coal-plant position to this non-union combined-cycle environment.
His comments touched on numerous aspects of daily management and life at the facility, including interpersonal relationship of staff and regard for the community, while focusing on the common issues of today’s environment. Items such as:
-
- Increasing merchant operations (PPAs fading away).
- Long-term agreements being modified or expiring.
- Ageing equipment and personnel.
- The need for more predictive maintenance.
- Competition for employees.
- OEM lack of experience.
- The need to do more with less.
His closing comments offered some hope, while touching on labor and skills shortages:
-
- Stay away from management fads.
- Welcome briefings on bad news.
- Seek employee opinions.
- Train operators to take action.
- Offer tours, tours, and more tours. Get employees noticed and involved.
- Promote community volunteerism.
- Be aware of changes in the energy market.
- Be ready for an unannounced audit or inspection at any time.
- Praise employees and calibrate when necessary.
In discussing training, he repeated Henry Ford: “The only thing worse than training your employees and having them leave is not training them and having them stay.”
He ended with a thought-provoking quote by Dale Carnegie: “Employees don’t leave companies, they leave people.”
Wednesday was reserved for presentations by the 2019 diamond sponsors, General Electric and Siemens, and platinum-plus sponsor Mechanical Dynamics & Analysis (MD&A). Participation was limited to users and personnel from the three sponsoring organizations.
Siemens personnel offered details on the following:
-
- Company organizational update.
- Energy market outlook in the US (including battery integration).
- Review of NERC critical infrastructure protection and cybersecurity data.
- Maximizing market participation through grid support and ancillary services.
- Increasing combined-cycle flexibility through exhaust purge credits, attemperator operation, and integrated Flex-Power Services™.
- Gas-turbine upgrades for higher capacity, increased efficiency and longer inspection intervals.
- Brownfield engine exchange programs (replacements and site repowering).
Experts from MD&A addressed specifics of balancing to reduce vibrations, not only on the turbine, but on other balance-of-plant (BOP) rotating equipment as well. Cautions were issued on common mistakes made while balancing. Details were then given for low- and high-speed balancing on location and at MD&A facilities, along with specific criteria for gas-turbine, steam-turbine, and generator rotors.
Alignment discussions and graphics focused on couplings and internals, specifications, and the impact of foundation settlement. Coupling example details covered both 16-point and laser methods and equipment.
GE spearheaded the afternoon discussions with a range of topics including:
-
- Fleet status.
- BOP considerations for gas-turbine upgrades.
- Layup, restoration, and restart guidelines.
- Remote monitoring experience for HRSGs.
- Ensuring combined cycle relevance in today’s renewable energy world.
- Selected case studies.
- Roundtable discussions.
Available Siemens, MD&A, and GE discussions in other user group tracks provided unique opportunities for CCUG participants to expand into specifics for generators, steam turbines, and powerplant controls.
The following day, MD&A conducted tours of its gas and steam turbine/generator repair facility in St. Louis.
Turbine Tip No. 2, from the Dave Lucier’s PAL Turbine Services O&M solutions library, applies to General Electric Frame 5 models K-LA and M-P, and early 6Bs, 7Bs, and 7Cs, equipped with Y&F fuel regulator and Speedtronic™ Mark I, II, and IV controls.
Overfiring a gas turbine during startup can be a serious condition, particularly when the engine is cold. As a GE gas turbine fires and warms up, fuel flow is controlled by the average exhaust temperature—called Txa. During the subsequent acceleration period, the starting means (diesel engine or electric motor), assists in bringing the turbine rotor up to rated operating speed.
On legacy units, as the coupled rotor passes through a mid-range zone, compressor air flow and pressure may be insufficient to maintain Txa under 950F, as recommended by the OEM. If your control system is incapable of limiting fuel flow to prevent the exhaust temperature from exceeding 950F, be advised that GE provided for manual control of its early gas turbines (years from 1960 to 1980).
In the decade of the 1960s, GE gas turbines used the Young & Franklin fuel regulator for engine control. In the early 1970s, Speedtronic became the electronic control and protection system of choice. In this 20-year span, the OEM provided methods for “overriding” the automatic controls with a manual feature on its gas turbines.
In Fig 1, an operator is shown “thumbing” General Electric Manufacturing Co’s (GEMAC) 70TC programmer to control exhaust temperature during acceleration of a Frame 5L gas turbine. This action limits Txa temporarily, by manually controlling fuel flow to the combustors. Once the temperature has “crested,” at about 2200 to 2400 rpm, the operator can release his thumb, allowing the timer to run up to its 100% stop.
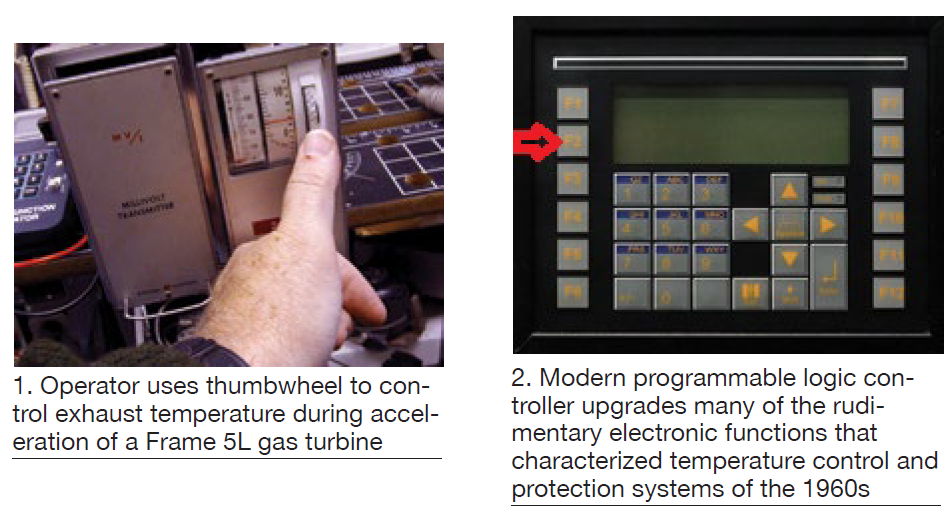
Several MS5001K-LA gas turbines installed in the mid-to-late 1960s have had their legacy temperature control and protection systems replaced/upgraded with a programmable logic controller (PLC), like the PAL GEMAC in Fig 2.
Recall that the technology of the day in the post Northeast Blackout era (November 1965) was early integrated circuitry. The operator-friendly PLC can perform many of the electronic functions from 50 years ago easier and faster. Example: Manual override with the PAL GEMAC is provided with the F2 function key (arrow in Fig 2)—much simpler to use than the thumbwheel feature it replaced.
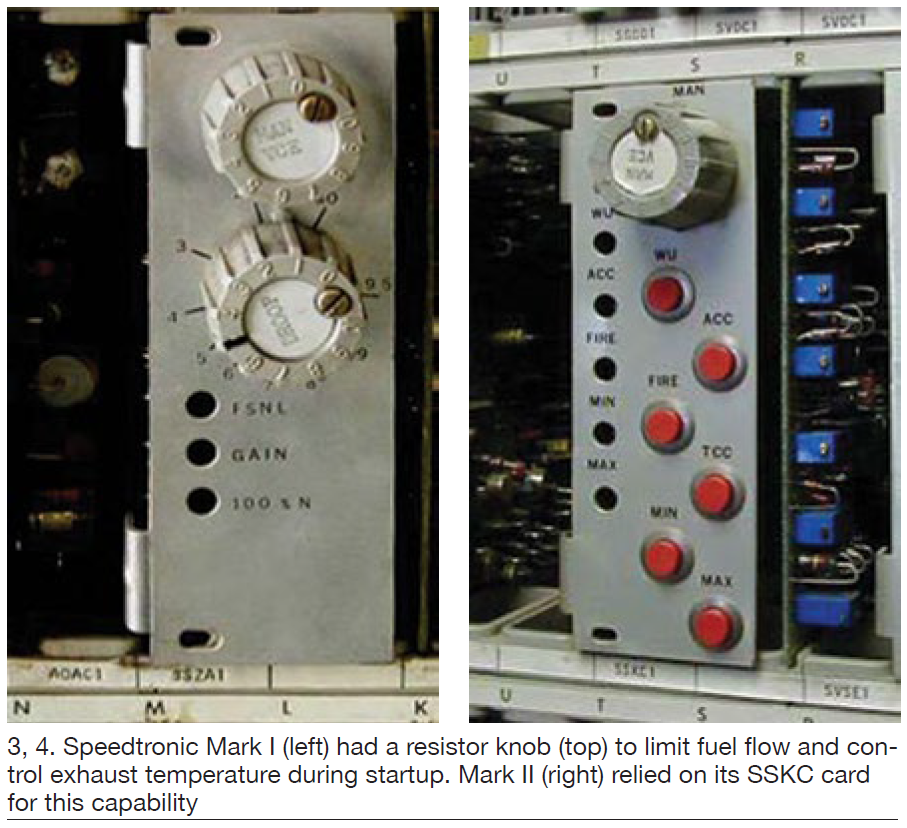
Beginning in the 1970s, Speedtronic Mark I controls had a manual resistor on the speed control circuit board called SSZA (Fig 3). It is the upper resistor knob in the photo—named MAN VCE for manual, variable control electronic, or minimum fuel command. Turning the knob to the right (clockwise) decreases the fuel control voltage, thus fuel flow. An alarm will sound. Fig 4 shows the later version of Speedtronic, the Mark II. Its MAN VCE is located on the SSKC card. The audible sound can be silenced, but the annunciator flag remains until the knob is returned to normal.
Case study. A user recently had a problem starting his MS5001N, equipped with Speedtronic Mark I controls. When the turbine reached approximately 1900 rpm the unit tripped because the average exhaust temperature exceeded its allowed operating limit of 1000F. Subsequent trips made the problem particularly difficult to diagnose. The diagnostics team believed the turbine had to continue operating, so the system could be observed and analyzed.
Plant personnel were unaware of the manual control option and the reasons why GE had installed it. The site engineer was advised to turn the MAN VCE knob clockwise during acceleration (at 1700-1800 rpm). Yes, the alarm sounded. VCE was limited temporarily, so troubleshooting could begin. In this case, it was desirable to run at a safe speed at an exhaust temperature less than 900F. I&C sleuths determined that a 240F comparator “oven” was defective and had to be replaced.
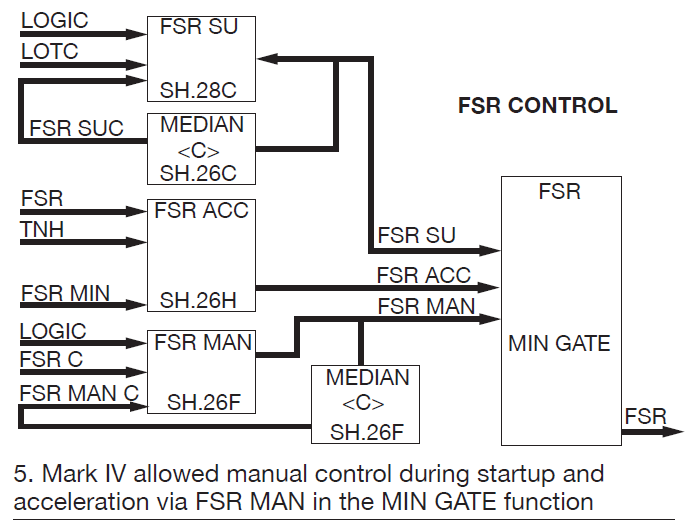
Even modern GE gas turbine control systems (circa 1980-1985), like the Speedtronic Mark IV (Fig 5), provided for manual control during turbine startup—should it be needed. Refer to FSR MAN in the MIN GATE function. During startup and acceleration, manual control is possible with this function, though on later-model gas turbines its use is less likely. The MIN GATE looks at all inputs and selects the one that “calls for” the lowest fuel flow. In this case, MAN VCE can be that one.
On a new Frame 5 gas turbine, the average exhaust temperature was expected to “crest” at about 810F approximately 3 minutes and 20 sections into the start cycle (red arrows in Fig 6), when the turbine was at about 80% speed (nominally 4000 rpm).
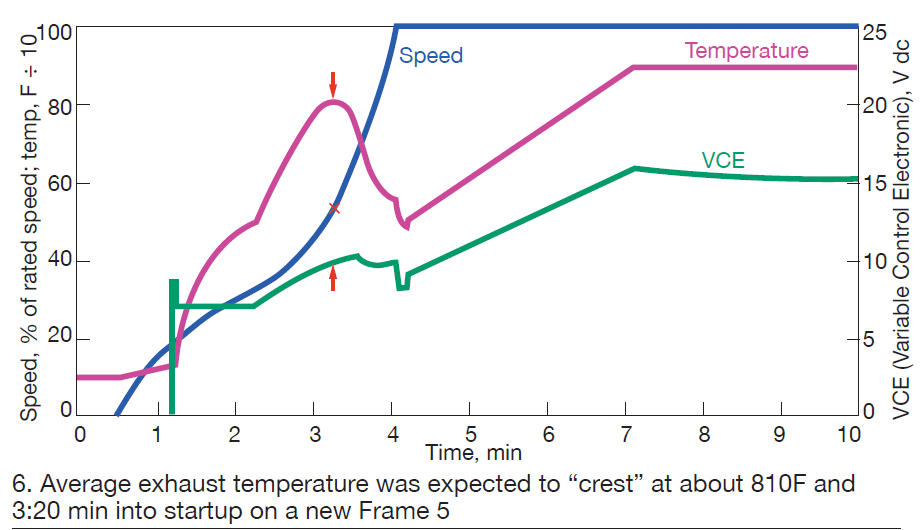
Bear in mind that if the temperature drifted too high, the turbine might trip on over-temperature. The operator could limit VCE manually (read 10 Vdc on the right vertical axis) to prevent a trip until the air flow and compressor discharge pressure increased to cool the exhaust. Perhaps a MAN VCE setting of 9.5 Vdc might work better in this case. Later, the ACCE VCE limit could be recalibrated lower to this same limit.
In conclusion, many legacy GE gas turbines have ways to temporarily control fuel flow (manually) to the combustors. During startup, it may be necessary to manually limit fuel flow until rotor speed passes through a critical zone (1800 to 2300 rpm). GE provided the controls to assist the operations team in troubleshooting.
Overfiring during startup
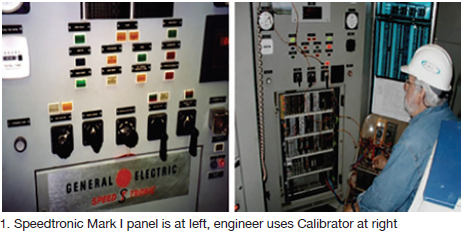
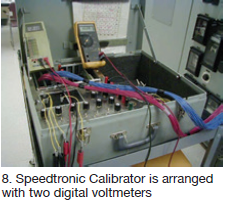
General Electric Speedtronic™ Mark I control systems were installed on gas turbines in the early 1970s, primarily on MS5001N and MS7001B engines. Fig 1 shows a typical Mark I panel being tested using a device known as the Speedtronic Calibrator. Note that the Calibrator has two ribbon connectors patched into designated locations and that the engineer is using digital voltmeters.
Case history. The owner/operator of a Frame 5N near Houston called PAL Turbine Services on a hot summer day and reported that its engine would “hang up” during startup when the speed reached about 1800 to 2000 rpm, well below the operating speed of 5100 rpm. Troubleshooting actions taken for the symptoms described on the phone had been unsuccessful. The situation was dire, the user said; power from this unit was needed urgently.
PAL General Manager Dave Lucier told the editors, “As good luck would have it, I had a set of Mark I turbine elementaries and control specifications with me. I accessed the Internet from my car, parked outside a hardware store, booted up my computer, called the plant operator, and then walked him through some troubleshooting techniques.
The turbine was shut down at the time. “I asked the technician, who had a millivolt source, to connect it to a particular amplifier associated with an analog output from the 12 control thermocouples (Fig 2). He found the gremlin, a blown 240F oven (Fig 3).

“With no spare on hand, I suggested that the technician borrow one from either OTA or OTB until we could supply one. Recall that the control card has three similar ovens. Inside the black box in Fig 2, there are these three so-called reference ovens:
-
- Average temperature control (TC-1 through TC-12); it creates signal TXA, a/k/a average exhaust temperature.
- Over-temperature control A (T1, T3, and T5); it creates signal
- Over-temperature control B (T2, T4, and T6); it creates signal
Other points to remember: GE temperature control and protection systems are not referenced to 0F. The output signal must exceed 240F before the analog output signal goes “positive.” Also, TXA, OTA, and OTB are “compared” for over-temperature protection. A disparity of about 50 deg F among the three temperatures triggers an alarm. Additionally, if OTA or OTB exceeds 970F an alarm occurs; at 1000F, the turbine will trip and shutdown.
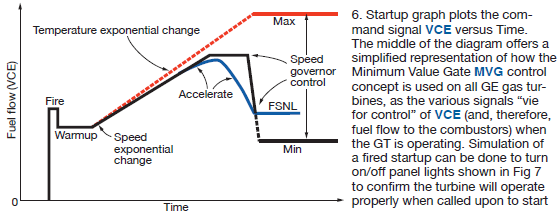
TXA is one of the functions that can “control” the voltage signal, hence fuel flow to the combustors. During turbine startup, there are three “competing” controls that can take charge of the command voltage signal called VCE, a/k/a variable control electronic (Fig 4, right).
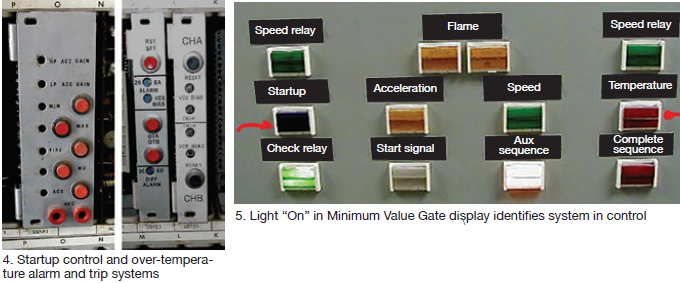
This is known as the minimum value gate MVG (Fig 5). Lights in the middle row of the photo identified by red arrows are the controls that can limit and lower the VCE voltage to control fuel flow. A light is “On” when in control.
During turbine startup (Fig 6), the following control variables can limit (or reduce) VCE and, therefore, limit fuel flow to the combustors:
1. ACCEL VCE limit. Default. High limit at 8.5 V when no other takes control. Blue light.
2. Accelerate exponential (VCE rate of change—0.2 V/sec. Adjustable on card.
3. Acceleration control—approximately 50 rpm/sec. Not adjustable on card. Yellow light.
4. Temperature exponential change (TXA rate of increase)—5 degF/sec. Red light.
Returning to the starting problem in Texas, it was determined that the 240F oven for the TXA reference failed because it overheated. Lucier continued, “To get plant personnel through the crisis, I asked the technician to unsolder the failed oven and install the OTA oven until we could provide the plant with a spare (used) card. In the meantime, operators would have to live with a continuous exhaust-temperature-differential alarm.
Lesson: It helps tremendously to understand the “normal operation” of GE gas turbines with Speedtronic Mark I control and protection systems. If you don’t know how the system is supposed to work, how can you recognize “abnormal” operating conditions.
Startup simulation
Speedtronic control systems provided with GE gas turbines from about 1970 to 1985 included two generations of controls designated Mark I, discussed above, and Mark II. Hundreds of these packaged powerplants were installed worldwide during that period, most with Mark II controls (Fig 7).
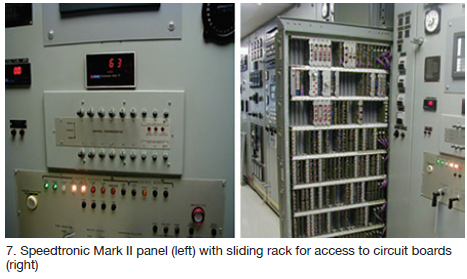
The focus here is on the Speedtronic Calibrator (refer back to Fig 1), which can be used to simulate a startup without firing the gas turbine. This could be useful to simply demonstrate that a startup likely would be successful, or perhaps when fuel is unavailable for some reason, or if emissions are of concern.
Signals can be created on the Calibrator using the power supplies from the panel. Once plugged in at the proper locations, four final regulators on the Speedtronic panel are sent to the Calibrator.
For the Mark I they are the following:
-
- +12 V dc (for digital signals).
- +28 V dc (for panel relays).
- +50 V dc (analog signals).
- -50 V dc (analog signals).
 For the Mark II on MS5001N and P, and MS7000B and C, engines:
-
- +6 V dc (for digital signals).
- +28 V dc (for panel relays).
- +12 V dc (analog signals).
- -12 V dc (analog signals).
The Calibrator has red and blue ribbon connectors, each with 51 pins, similar to the circuit boards on the Speedtronic panels; the Calibrator should be connected only to specific dedicated slot locations.
A “patchboard” is provided to jumper signals to the appropriate circuits, as well as to connect digital voltmeters (Fig 8). Resistors on the right side of the Calibrator allow for adjustments of speed (NHP), temperature (TXA), and another dc voltage source for pressure signals (PCD or P2).
The basic tasks for simulations fall into the following categories (with GE signals designated):
1. Speed signal NHP—0 to 100% (5100 rpm on Frame 5N or Frame 5P).
2. Speed signal to energize speed relays—14HR, 14HM, 14HA, and 14HS.
3. Digital setpoint (DSP) for speed control and speed droop, referred to as the “called-for” speed.
4. Exhaust temperature (TXA) for temperature control simulation.
5. Pressure transmitter simulation (PCD)—voltage signal proportional to air pressure.
6. Gas fuel pressure (P2) for fuel controls—voltage compared to NHP.
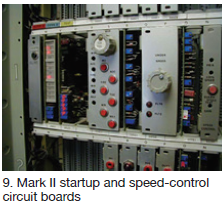 Fig 9 shows Row 1 of the Speedtronic panel, which holds the startup and speed-control circuitry. Other rows hold the cards for turbine operation. The Calibrator can send signals to various circuits for simulation, as desired. A trained engineer or technician will find useful the techniques provided in the GE control specifications and other training documents.
Wrapping up, simulation is a good way to test Speedtronic Mark I and Mark II gas-turbine controls using the OEM’s Calibrator. This saves time and fuel when actual turbine operation is undesirable.
Air inlet systems—including filter houses, evaporative coolers, cooling-coil support structure, silencers, ductwork, etc—seldom get the respect they deserve. Properly maintained, they help assure maximum output and high availability of your gas turbines. Yet, they are almost an afterthought at many plants, the focus being primarily on rotating equipment.
Annual inspection of the air inlet system by plant personnel typically is recommended by owner/operator colleagues participating in discussion sessions on the subject at user-group meetings. Those discussions typically focus on air filtration alternatives and inlet cooling systems (evaporative coolers, foggers, chillers), paying minimal attention to the structural elements of the filter house and bellmouth.
Air inlet systems can be divided into four parts: (1) bellmouth or inlet scroll, (2) inlet plenum, (3) clean-air side, and (4) dirty-air side. It’s very important to inspect for coating failures on the carbon-steel surfaces within the filter house and plenum, and downstream to the bellmouth,
Rust, paint chips, and debris released on the clean-air side downstream of the filters (Fig 1), are swept along by the high-velocity air stream and can impact and damage critical components—such as the bellmouth (Fig 2) and compressor airfoils.
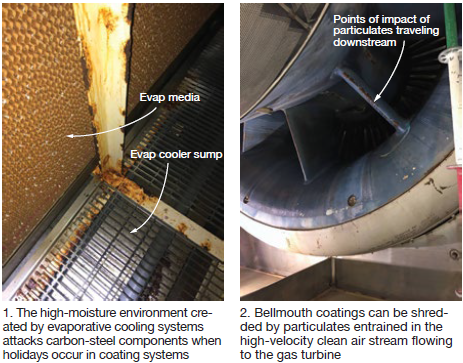
Corrosion can be a troublesome problem where filter houses are installed near wet cooling towers and/or when fogging systems are used for evaporative cooling. When corrective action is necessary, users should give special consideration to the outage window, degree of surface preparation, quality of the coating system specified, and the painting contractor’s qualifications and competency to maximize maintenance intervals.
Options for steel preparation are determined by the condition of the material and the existing coating system. Proven options, according to the experts at Taylor’s Industrial Coatings Inc (TIC), are (1) high-pressure water blasting with spot power tooling of severely corroded areas, and (2) grit-blasting.
OEM coating specifications typically call for an inorganic zinc primer, epoxy intermediate, and/or top coat. This is a respected coating system for shop-applied products—when done correctly. However, Troy Waters, TIC’s field superintendent, explained that zinc primers sometimes are not applied in accordance with the manufacturer’s instructions and may not maintain their integrity for the expected service life.
Reasons include the failure to (1) adhere to the manufacturer’s recommended 24-hr minimum recoat time, (2) remove loose zinc dust from fall out/overspray, and/or (3) take the extra step in promoting adhesion of the subsequent coat by screening the zinc prior to the epoxy intermediate or top-coat application.
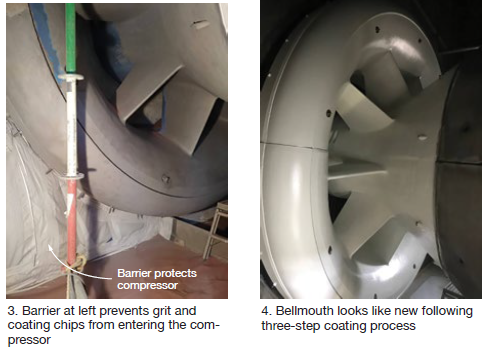
To protect against delamination and corrosion, TIC created a proprietary coating system which it says has been validated in the harshest of environments—including coastal, high humidity, and highly polluted atmospheres.
TIC’s management strongly recommends against recoating the bellmouth until inspections are performed upstream by its experts and they confirm the coating is well-adhered to metal surfaces. Were coating material to release into the air stream it could quickly compromise the new asset protection coating system downstream.
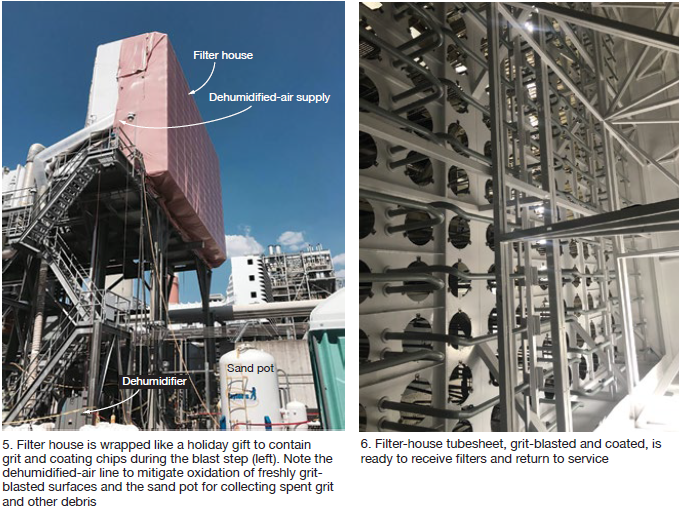
Figs 3-6 illustrate work by TIC personnel on the filter house of a 7FA about halfway through the engine’s nominal design life of 30 years. In this case, particles of rust and coating released from the bellmouth and upstream components were damaging the smooth profiles of airfoils, therefore reducing compressor efficiency.


