Editor’s note: The traditional annual conferences of all user groups serving the gas-turbine sector of the US electric-power industry scheduled between Mar 1, 2020 and Dec 31 have been canceled because of the Covid-19 pandemic. The 30th anniversary meeting of the Western Turbine Users (slated for March 29 to April 1 at the Long Beach Convention Center) was one of the organizations so affected.
Ned Congdon, PE, of HRST Inc, who was scheduled to speak in the Special Technical Presentations session on March 31, shared his talking points on problems to anticipate with ageing HRSGs with Contributing Editor David Benjamin, an aero user, who developed the article that follows from those notes.
Many heat-recovery steam generators (HRSGs) were installed during the combined-cycle boom of 2000 to 2005, putting them roughly halfway through their 30-yr design lifetimes. While the majority of boilers experience some form of tube distress by this point, there is much that can be done to bolster their health. With good operations and maintenance informed by experienced judgment, typical design lives can be extended appreciably. It is crucial to know what to look for, and when to take corrective action. Informed forethought can help avoid costly repairs requiring extended forced outages.
Congdon highlighted the following points in his presentation, among others:
-
- Duct-burner flame management.
- Internal oxide deposits on superheater and reheater tubes.
- Duct-burner liner replacements.
- Creep-damage assessment of piping for superheated steam.
- Return-bend economizer failures.
The HRSG expert discussed the ways in which careful duct-burner flame management is essential for maintaining the health of an ageing boiler. Many simple operational parameters are commonly overlooked and can contribute significantly to the likelihood of tube failures. It is crucial to maintain proper flame shape, to ensure a uniform vertical distribution of flue-gas, and to prevent flames from overextending and impinging on downstream tube panels.
For HRSGs with supplementary firing, the highest tube-metal temperatures and heat fluxes typically occur on the tube banks immediately downstream of the duct burners. Tube-overheating failures typically occur in this area. Sometimes, finless screen tubes with reduced heat-transfer characteristics are placed in front of the primary superheater/reheater surface to take brunt of the heat flux. In that case, the risk of a tube overheating is highest for the superheat/reheater surface immediately downstream of the screen tubes.
Duct-burner flames should be checked by operators during rounds. When looking through a viewport, a good rule-of-thumb is that the flame should extend no more than half to two-thirds of the length of the firing duct. Flames should be independent of each other, and should be completely horizontal. It is important all flames be of uniform length; higher elevation flames may be longer, which signifies non-uniform gas flow. The visible portion of the flame should end no closer than 6 ft from the first tube panel. Be sure flames never contact the tubes!
A good 21st century alternative to viewports is a set of duct-burner cameras. They may be mounted on the floor, roof, or walls of the firing duct and send a wireless signal to a DAQ device connected to the plant’s main control system. Cameras require purge air for cooling. Because the cameras are monitored from the control room, they can help identify early signs of burner trouble while avoiding the hazards and inconsistencies of frequent (or infrequent) viewport use.
Flow control. Congdon noted that users often will be forced to repair perforated flow-distribution plates in the hot gas path, and may chose not to replace them because of the high frequency of their decay. While it may be possible to remove perforated plates without going out of emissions compliance, insidious maintenance issues can develop.
The most frequently observed problem resulting from removing perforated plates from the gas path is bad flame shape—local back-eddies are a particular issue that damages liner and burner components. Another issue associated with perforated-plate removal is excessive flame length in the upper portion of the duct. This can lead to non-uniform tube metal temperatures, overheating of the tubes at high elevations, and, ultimately, tube failures.
Flow-distribution plates slow down the gas velocity in the lower portion of the firing duct where turbine outlet pressure is highest. Without the perforated plates in place, the exhaust flow profile would naturally favor the lower portion of the firing duct, and higher elevations would have significantly less exhaust gas flow.
With reduced gas flow, mixing is diminished. The stoichiometry becomes offset, since burner elements put out uniform quantities of fuel, but the quantity of air is suppressed at higher elevations. Even though the flow velocity is lower, the flame takes much longer to consume the fuel, resulting in an extended flame length. This is often referred to as a “long lazy flame.”
Thus, it generally is not a good idea to remove perforated plates from the gas flow path. The result is often slowly forming damage to the higher portions of the tube panels, where inspections tend to be less common. Such tube damage often goes unnoticed until a full-on leak demands a forced outage. A drone inspection can aid O&M teams to pinpoint upper-level tube damage in boilers where an uneven gas flow profile is suspected.
Internal deposits. Congdon discussed several problems associated with the growth of oxides along the inside walls of superheater and reheater tubes made of steels containing chromium. In small quantities, oxides protect the tubes from corrosion. However, too much internal oxide growth, or an uneven distribution profile, can insulate sections of tubes, creating temperature imbalances that can cause creep damage and ultimately lead to failure.
Many chromium steel alloys have been used in the manufacture of superheater and reheater tubes. High-chrome alloys, such as T91, generally produce less oxide growth, but also tend to be more expensive. Many ageing boilers were fabricated with lower chromium-containing alloys, such as T11 and T22, and are highly prone to oxide growth over time. Superheater and reheater panels with high heat flux are especially vulnerable to damage from internal oxide growth, because tubes in these sections generally were not designed with a high margin for wall thickness or deviation in temperature gradients.
Internal oxide growth along a superheater or reheater tube can result in tube swelling over an extended period of time, and may eventually lead to a complete rupture. The oxide layer insulates the internal surface of the tube, adding an additional thermal resistance to the heat-transfer path between the flue gas and the steam. This causes the tube metal to reach thermal equilibrium at a higher temperature, overheating the metal.
With added thermal resistance from an excessive internal oxide layer, the operating temperature of the tube metal goes up. The tube wall then becomes slightly more plastic, and the tube slowly begins to yield to the hoop stress generated by the steam. Over time, the tube will swell as the tube metal starts to yield as creep.
Aside from reducing burner heat release, there is little that can be done to reduce internal oxide growth in low-chromium-content steel alloy tubes. Superheater and reheater tube panels with high heat flux should be inspected regularly during the latter half of the boiler’s design life. Internal oxide growth can be qualitatively assessed by borescope inspection, and can be quantitatively measured using NDE techniques.
If excessive oxide growth is suspected, it’s a good idea to measure tube ODs at strategic locations to get an idea of how much swelling has taken place. Swollen tubes must be replaced; they generally cannot be saved. If the OD has swollen by 3% or more, HRST recommends derating the burner until the tubes can be replaced.
A quantitative engineering analysis is required to determine by what percentage the burners must be de-rated to preserve the lifespan of the tubes to the next available outage. It is generally good practice to be proactive in identifying and replacing swollen tubes before they rupture.
High levels of internal oxides also can result in the liberation of oxide flakes and particulates into the steam. This can be erosive to steam turbine blading. If excessive oxide growth is suspected, consider installing a duplex strainer before the steam-turbine inlet, if there is not already one in place. This can prevent erosion damage to the first few stages of blading from liberated oxides.
Firing ducts. Congdon discussed failures of stainless-steel liner panels typical of older boiler designs. Type-309 stainless steel often was used to line firing ducts in boilers installed 15 or more years ago. Type 309 has good oxidation resistance, but tends to warp in high-temperature environments.
Many users find themselves having to repeatedly reline boiler walls around the duct burner during maintenance outages. Some users who had encountered this problem found success in retrofitting the lining with ceramic-fiber modules. While there is a high one-time cost incurred by this, it reduces the frequent need to reline the firing ducts. A cost-benefit analysis may favor this decision in the long-run, while it may also increase reliability and reduce downtime.
Steam-line creep. In ageing plants, it can be helpful to investigate the health of high-temperature steam lines with regard to creep damage. The potential for creep damage can be analyzed remotely using process modeling software to determine the most likely weak spots in the pipes. The analysis can then be assimilated into a site-specific test program to strategically focus the NDE on the most probable locations for damage.
Return-bend economizers. Congdon discussed the commonly encountered failure of return-bend economizers resulting from tube-to-tube temperature differentials with a top-supported structural design. Ageing return-bend economizers often are prone to failures at the bends. Temperature differentials may develop between economizer tubes during transient startup periods, causing uneven thermal expansion of the tubes. Return-bend economizers usually are top-supported at the inside of the tube bends by a support beam.
Tubes at high temperatures will elongate and no longer support the load of the economizer. Thus, the mechanical load concentrates on the cooler tubes, causing an off-design distribution of weight. The result is a higher concentration of stress at the bends of the cooler tubes, which can lead to cyclic stress, fatigue, corrosion fatigue, and stress corrosion cracking failures.
Temperature differentials occur naturally during startup in return-bend economizers where cold water flows into the top of the top-supported header. These conditions may be exacerbated by air pockets in the bends, which are not vented easily. Operationally, maintaining a small but steady water flow through the economizer during startup can help smooth out the temperature differences.
A good long-term maintenance solution is to retrofit a support system that isn’t prone to transient differential stress loading. HRST developed a support system design for return-bend economizers that can redistribute the stresses to the bottom of the unit. Supports can be retrofitted to eliminate the support rods in favor of a bottom-supported design with spring isolators to help buffer transient deformations. This design prevents high stresses at upper tube bends, eliminating the risk of failure in those locations.
Special to CCJ ONsite
By Larry Muzio and Sean Bogseth, Fossil Energy Research Corp, and Frederic Vitse, GE Power Portfolio
Selective catalytic reduction (SCR) is widely used to reduce NOx emissions from gas-turbine powerplants—both simple- and combined-cycle units. Once the catalyst is installed it is important to monitor its activity periodically. This involves removing a sample from the unit and testing for its activity in a laboratory. Test frequency can vary from yearly to every two to three years, depending on site-specific issues relating to potential catalyst poisons.
Protocols developed by Germany’s VGB for testing SCR catalysts from coal-fired boilers are described in Refs 1 and 2. EPRI’s Catalyst Testing Protocol, published in 2007, is explained in Ref 3. EPRI later (2015) released testing guidelines for SCR and CO catalysts used in gas-turbine powerplants (Ref 4).
This article discusses issues with testing SCR catalysts used in simple-cycle gas-turbine systems that are not addressed in the testing guidelines. The catalysts in simple-cycle units typically operate in a temperature range of 750F to 850F; more typically, 800F to 850F.
The guidelines in Ref 4 for testing gas-turbine SCR catalysts describe two ways to monitor catalyst life:
-
- Monitor the parameter “catalyst activity, K,” over the life of the catalyst.
- Monitor the NOx reduction achievable by the catalyst at the NH3 slip limit—again over the life of the catalyst.
The authors focus here on measuring catalyst activity in the laboratory. Note that K varies with the chemical composition of the catalyst, its geometry (for example, mass transfer in the catalyst channels), and operating parameters (for example, temperature and area velocity). Area velocity (Av) is the ratio of flue-gas flow to the active catalyst surface area. Lower Av means more catalyst per unit of flue gas.
To determine catalyst activity, the NOx reduction is measured across the catalyst and its activity is calculated from the equation:

where deltaNOx is the measured NOx reduction across the catalyst and Av is the area velocity, which depends on the area of the catalyst in the catalyst channels.
Laboratory test conditions typically are arranged to duplicate full-scale temperature and area velocity. The EPRI guidelines specify that the activity be determined at a NH3/NOx ratio of 1.2.
The challenge with simple-cycle SCR catalysts operating at relatively high temperatures (800F to 850F) is that reactions other than the basic SCR reaction can occur—as indicated by equations A to C below.
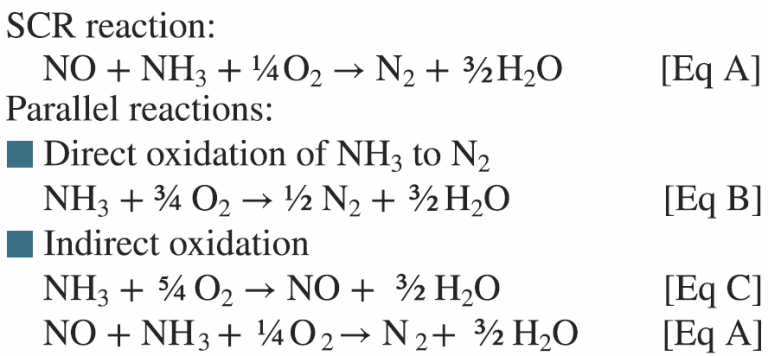
These parallel oxidation reactions of ammonia essentially compete for the ammonia that is injected and used for SCR NOx reduction. For instance, the EPRI GT SCR catalyst testing guidelines specify that an inlet NH3/NOx ratio of 1.2 be used to measure the activity. If ammonia oxidation reactions described by equations A to C are taking place in parallel, then the ammonia available for the SCR reaction (Eq A) is less than the NH3/NOx = 1.2 injected as specified in the guidelines. This will result in a lower NOx reduction and an artificially low activity K. If not accounted for this can lead to a premature recommendation to change the catalyst.
A second impact of these side reactions is that even if the required NOx reduction can be achieved, the required reagent consumption can be higher than anticipated.
It is not the authors’ purpose to discuss what catalyst formulations and properties promote these oxidation reactions. Rather, some typical examples presented below show the impacts of the oxidation reactions along with recommendations on how to deal with these issues during laboratory testing.
The following discussion focuses on laboratory tests of SCR Catalysts A and B. Fig 1 shows test results in terms of NOx reduction and NH3 slip as a function of the inlet NH3/NOx ratio for Catalyst A at 850F and an area velocity of 10.8 m/hr.
The following observations are noteworthy in this figure:
-
- NOx reduction continues to increase markedly as the injected NH3/NOx ratio increases from 1.0 to 2. One normally expects this curve to flatten at NH3/NOx ratios just over 1.0 at laboratory conditions.
- At NH3/NOx ratios greater than 2, the NOx reductions achievable are quite high.
- NH3 slip does not start to increase until the NH3/NOx ratio approaches 1.5. Typically, one would expect the NH3 slip to increase as the NH3/NOx ratio exceeds 1.0.

These characterizations point to the side reactions involving NH3 oxidation competing with the basic SCR reaction. The magnitude of the oxidation reactions can be quantified by calculating the NH3/NOx ratio based on the measured NOx reduction that is actually occurring, along with the measured NH3 slip:

The difference between the injected NH3/NOx ratio (NH3/NOx-in) and the “effective” NH3/NOx ratio (NH3/NOx-eff, Eq 2) is the amount of the injected NH3 that was oxidized via the parallel reactions discussed above and not used for SCR NOx reduction. To determine this effective NH3/NOx ratio, an accurate NH3 slip measurement is required, along with the inlet and outlet NOx concentrations during the laboratory tests.
To illustrate these oxidation reactions, the data in Fig 1 are replotted in Fig 2 using the NH3/NOx-eff ratio, as calculated from Eq 2, as the x-axis.
As can be seen in Fig 2, these trends appear more “as expected” for an SCR process:
-
- NOx-reduction trend curve flattens as NH3/NOx-eff increases above 1.0.
- NH3 slip begins to increase at NH3/NOx > 1.
For the performance data shown in Fig 1, if the SCR system must achieve 90% NOx reduction, the actual injected NH3/NOx ratio required would be a nominal 1.7. By contrast, Fig 2 shows that the actual NH3/NOx ratio participating in the NOx reduction need only be about 1.0 for 90% NOx reduction—provided there was no NH3 oxidation in parallel with the SCR reaction.
In terms of tracking catalyst activity and life using an inlet NH3/NOx ratio of 1.2 as specified in the testing guidelines, the catalyst activity would be calculated to be 16.3 m/hr. Using the effective NH3/NOx = 1.2 results in an activity of 29.7 m/hr—almost double. Clearly, unless oxidation is accounted for, management of Catalyst A is difficult using the current EPRI testing guidelines.
Not all catalysts exhibit the same degree of ammonia oxidation. An easy way to compare catalysts is to compare the relationship between the injected NH3/NOx ratio and the NH3/NOx-eff calculated from Eq 2. This comparison is shown in Fig 3 for Catalyst A and a second catalyst, Catalyst B, tested under similar conditions. Using a linear curve fit through the data shown in Fig 3 indicates that for Catalyst A, 48% of the injected ammonia at NH3/NOx = 3 is oxidized and does not participate in the SCR reactions.
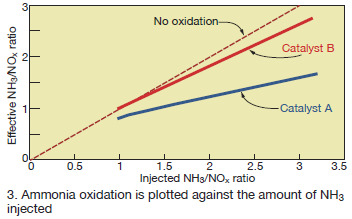
For Catalyst B, the ammonia oxidation is less than 12% at NH3/NOx = 3. Also, the amount of oxidation increases as the amount of ammonia injected increases: At NH3/NOx-eff of 1.0, Catalyst A and B oxidize 20% and 0%, respectively.
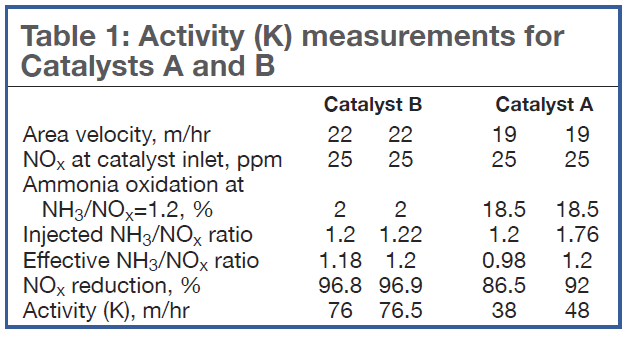
Table 1 compares the activity K measured for Catalysts A and B if the measurements are done at either an inlet NH3/NOx ratio of 1.2 according to the testing guidelines, or at the effective NH3/NOx ratio defined in Eq 2. Note that Catalyst B exhibits little oxidation: There is little difference in the measured activity (76 versus 76.5 m/hr). However, for Catalyst A, which exhibits a higher level of ammonia oxidation, there is a large difference in the activities (38 versus 48 m/hr).
If the activity measurements shown in Table 1 are to be used to make performance predictions, there will be a large difference in these predictions for Catalyst A. Fig 4 shows the predicted performance for Catalyst A operating at an area velocity of 19 m/hr and inlet NOx of 25 ppm with a velocity and NH3/NOx maldistribution of 15% RMS and 10% RMS, respectively.
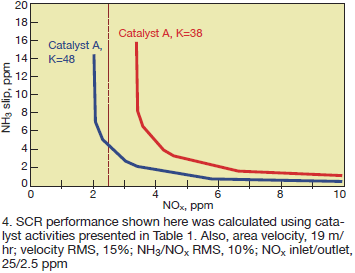
If the SCR system must achieve 90% NOx reduction, and the activity measurement was only made at NH3/NOx = 1.2 based on the inlet ratio, one might conclude that the catalyst is “beyond end-of-life.” However, making the measurement at an “effective” NH3/NOx ratio of 1.2 (Eq 2), the catalyst can still achieve 90% NOx reduction.
If activity measurements are to be made on these catalysts operating at high temperatures, you should consider how these activity measurements will be used.
Even if the catalyst activity measurements are being made to track relative activity (K/Ko) where the catalyst vendor has specified a K/Ko value at the “end-of-life,” there can be issues. If the amount of ammonia oxidation changes as the catalyst ages, then the K/K0 parameter based on an activity measured using an inlet NH3/NOx ratio of 1.2 may also be in error.
Impact of catalyst size. When testing a catalyst for which the oxidation reactions of ammonia are not negligible, special care must be taken to understand the impact of catalyst length. Table 2 shows that, all other parameters remaining constant during lab tests, the catalyst length can substantially favor the overall kinetics of ammonia oxidation over the deNOx reaction.
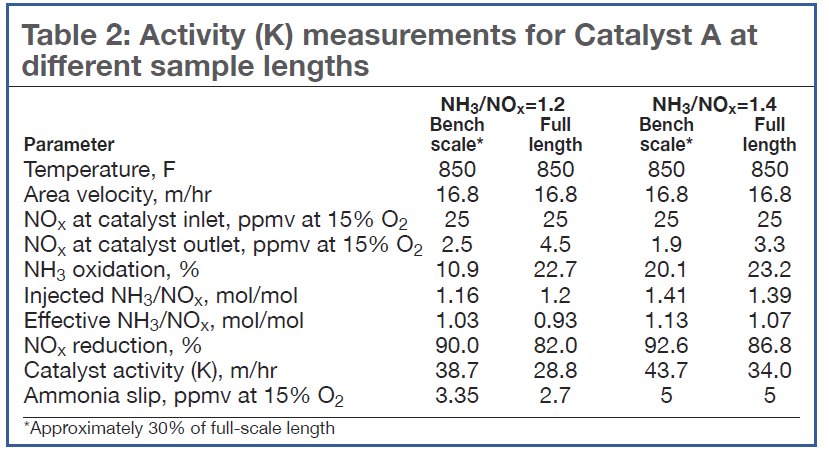
For NH3/NOx = 1.2, the longer catalyst sample resulted in an increase in the ammonia oxidation by more than a factor of 2. As a result, the NOx reduction decreased from 90% to 82%. At the higher NH3/NOx ratio of 1.4, the ammonia oxidation increase was less, about 3%, but still reduced NOx from 92.6% to 86.8%.
Therefore, if catalyst performance is to be validated by lab testing at reduced scale, particular attention should be given to the amount of ammonia oxidation observed at that scale. If the amount of ammonia oxidation is large, a performance test at full-scale catalyst length is recommended to capture a representative activity under field conditions.
Recommendations. For SCR catalysts operating at temperatures of 800F to 850F, oxidation of a portion of the injected ammonia must be addressed when characterizing catalyst performance in the laboratory. The current testing guidelines for gas turbine SCR catalysts are silent in terms of these parallel oxidation reactions at such high temperatures.
When laboratory catalyst tests are conducted, measure ammonia slip along with the inlet and outlet NOx measurements. This will allow calculation of the effective NH3/NOx ratio (Eq 2), resulting in a more accurate determination of the actual catalyst activity as well as quantifying what fraction of the injected ammonia is oxidized and does not participate in the SCR NOx reduction process.
As mentioned earlier, the gas-turbine SCR testing guidelines also describe a test where catalyst performance is tracked over time by measuring the NOx reduction that can be achieved at the NH3 slip limit with laboratory operating parameters matching full-scale operating parameters. While this procedure is not directly influenced by ammonia oxidation, it would be good if along with the NOx reduction achievable at the NH3 slip limit, the test results also include the inlet NH3/NOx ratio needed to yield the NH3 slip limit. This would allow changes in ammonia oxidation to be monitored as the catalyst ages.
References
- 1. “Guidelines for the Testing of deNOx Catalysts,” VGB-R 302 He, VGB Technical Association of Large Power Plant Operators, 1998.
- 2. “Common Best Practices for Bench Scale Reactor Testing and Chemical Analysis of SCR deNOx Catalyst,” Supplement to VGB-R 302 He, 2nd Ed, STEAG GmbH, May 2006.
- 3. “Protocol for Laboratory Testing of SCR Catalyst Samples,” 1014256, 2nd Ed, EPRI, 2007.
- 4. “Laboratory Testing Guidelines for Gas Turbine Selective Catalytic Reduction (SCR) and CO Catalysts,” 3002006042, EPRI, 2015.
 The 2020 Digital Conference hosted by the 7F Users Group was the first web-based annual meeting conducted by a user group serving owner/operators of gas-turbine-powered simple- and combined-cycle generating plants in the US. Most of nearly 700 registered users believed the 13-day event, conducted over five weeks from June 16 through July 16, exceeded expectations.
 Technical content provided by the OEM, summarized here, was well-organized and thorough (given time constraints), with several dozen very capable managers and engineers from GE Gas Power and FieldCore making presentations, participating in discussions, and answering questions from wherever they were located—in offices, in homes, and at jobsites.
Tom Freeman, chief customer consultant for GE Gas Power-Americas, coordinated the OEM’s program and was always on the ready to answer questions, fill an informational divot, provide background on speakers and discussion topics, etc.
Highlights of information incorporated into the OEM’s presentations follows. It is intended to provide a “flavor” of the broad range of topics addressed so you know what slides/videos posted on GE’s myDashboard website you might want to access for a deeper dive. The link for GE users to register or sign into myDashboard is: registration.gepower.com/registration/. Think of the CCJ summaries as a “TV Guide” for the web—a shortcut to material of interest.
Opening remarks, Day Three, June 18
GE’s first appearance at the event was on third and final day of the Week One program. The theme of the OEM’s opening remarks was “Looking Forward to the Last 30 Years.” Alvaro Anzola, VP of combined cycle services for the Americas, opened the program with a historical technical review of the 7FA. The first F-class gas turbine, rated 147 MW at a firing temperature of 2300F, began commercial operation at Vepco’s (now Dominion) Chesterfield Power Station in June 1990.
A timeline highlighting significant events in the life of this frame—including DLN-2.0 in 1993, OpFlex solutions in 2004, Advanced Gas Path in 2009, etc—is a great slide for testing your memory. It and all of the other GE presentations are available on-demand on myDashboard. An interesting statistic from Anzola’s presentation: GE deployed more than 5400 upgrades to the fleet from 2011 through 2019 to reduce emissions and/or to increase efficiency, reliability, output, and operational flexibility.
A special presentation, “Quantifying the Value of Flexibility,” by Professor Mort Webster and others from Penn State’s Dept of Energy and Mineral Engineering, followed. If you’re an asset manager, or have responsibility for generator scheduling and dispatch, consider retrieving this presentation. It discusses the system dynamics that determine how a unit might be dispatched with features added to improve flexibility—such as higher maximum output, lower minimum output, faster ramping, faster startup—and the financial benefits of these improvements.
State-of-the-fleet presentations at user-group meetings typically keep attendee eyes glued to the screen. No different at this conference. Diane Beagle, GM of global product service, and engineering leaders Brian Moran, a GT expert and Josh Sater, a plant systems expert, compiled stats of interest to the group and reviewed hot topics in the fleet.
Example: F-class starting reliability data from Strategic Power Systems Inc’s ORAP information system shows GE at 98.9% each year from 2016 through 2019 (except for 98.7% in 2018)—about half a percentage point ahead of the aggregate industry results that include the GE data. A poll of the attendees revealed that the leading causes of failed starts were valves (23%), controls (22%), and instrumentation (20%).
Also according to ORAP data, GE’s F-class reliability (includes gas turbine, generator, and station equipment) outpaced the competition from 2016 through 2019, averaging more than 97.9% to the industry’s 97.4% (including GE). When queried about the equipment responsible for most forced-outage days, users put instrumentation (29%) and transformers (19%) at the top of their lists.
Moran addressed these three “hot” topics in his presentation:
-
- DLN-2.6+ effusion plant cracking.
- Stator 5 root cause analysis.
- Flared enhanced compressor.
The first examined cracks between the center and outer fuel nozzles found in effusion plates with laser- and EDM-drilled holes after about 3000 hours of operation. Thermal strains from cycling were said to drive crack propagation along the high-heat-affected zones. Corrective action: Replace cracked caps with in-kind replacements until validation tests of a new TBC-coated effusion plate are complete—possibly by year-end.
The Row 5 RCA confirmed that the flared-7F events experienced in the fleet require “increased risk factors” for crack initiation—and that new and clean stator vanes have significant fatigue margin. Moran told attendees that the following issues could reduce fatigue margin: corrosion pitting, heavy tip rubs, FOD/DOD, and compressor surges. An elevated response would be caused by vane lock-up and loss of damping as well as heavy tip rubs.
Moran closed with a discussion on enhanced 7F flared compressor options, reviewing the features associated with Packages 2, 2+, 3, 4, and 5. He also discussed the enhancements for Rows S14-S16, reviewing both the “Big Foot” and “Little Foot” mods. You may recall that the advantage of the latter is that no casing machining is necessary and the work typically is completed in four days.
Sater spoke after Moran, focusing on the programs for the dedicated breakout sessions aggregated under a “Transforming a Mature Fleet” banner and scheduled four weeks hence in Week Five. Check out Sater’s slides covering safety, maintenance, forced-outage mitigation, and outage considerations on myDashboard to gain access to materials of interest.
FieldCore, Day Eight, July 2
FieldCore Day was divided into the following four segments, each of which can be accessed by registered users on myDashboard:
-
- Opening remarks and state of FieldCore.
- 7F landscape/update and best practices.
- Houston Learning Center and training.
- Delivering capability.
The first recorded video features opening remarks by FieldCore President/CEO Amir Hafzalla (02:30), who introduced his company as Gas Power’s field services arm, characterizing the business unit as “acting with humility, leading with transparency, and delivering with focus.” It is GE, he said. Hafzalla stressed his goals of continuous improvement, safety, quality, and integrity. Note that the numbers in parentheses throughout the FieldCore segment are the times where the persons identified begin their presentations. This should help you access quickly the information of greatest interest.
Brad Hilt (13:00), managing director, GE Gas Power Services, began by reliving what he learned from customers at last year’s 7F conference regarding field-service performance. Customers, in general, were not “happy campers.” Hilt explained how the company has addressed, and is continuing to address, the feedback received. Here are a few of the actions taken:
-
- Driving accountability, clear communication, and aligned roles/responsibilities for better customer outcomes.
- Shifting of the outage planning process from reactive to proactive.
- Building EHS and quality consistency into outage planning and execution.
Hilt then reviewed preliminary results from the performance-improvement effort. He listed several complimentary sound bites from surveys conducted recently by GE. Access the presentation and see if you agree. A survey of participants in the 7F meeting revealed that nearly half of the respondents believed the GE outage team performed noticeably or slightly better in the last year than previously. Roughly 30% checked “about the same.”
The 7F landscape/update and best practices segment brought users up to date on FieldCore’s achievements and introduced owner/operators to the service company’s key personnel. Mort Smith (00:00), GM of the FieldCore service team in North America, spoke first, summarizing key takeaways and experience from work conducted in the first half of 2020—including improving job quality and a safety record second to none. Ryan Hooley (07:00) of GE Gas Power was next, discussing the company’s Covid-19 response and outage management. He said Gas Power executed 134 major events during the six-month period with no significant safety (Level A/B) or operational implications.
Underpinning this success was the creation of more than 15 procedures and protocols specific to
Covid-19 safety, site execution, and preparedness. Plus, the prompt communication of changes to protocols, suspected and confirmed cases, best practices, and emerging risks.
Jeremy Williams (11:00), North American quality director for FieldCore, traced the continuing improvement in field-service work by the company. He pointed to the following 2017-2019 results: 35% reduction in “severe” events and a 40% reduction in customer lost-generation days. Credited were increased defect capture, aligned audit program, and increased leadership engagement around planning, resourcing, and execution.
Several Covid-19 solutions and best practices were integrated into this portion of the Day Eight program to illustrate employee commitment to better outcomes and customer support. The first “Covid Heroes” film clip showed Service Manager Matt Wallace’s (13:10) success in producing large numbers of small plastic bottles of a foaming hand sanitizer for use by field personnel. Field Engineer Brian Manzo (14:50) then presented for a few minutes on a 7F outage excellence solution involving a well-stocked 8-ft conex container, complete with tools and spare parts for a given job.
Brian Yu, US West region outage manager, (22:40) illustrated the value of a partial LOTO, whereby getting fuel gas and CO2 on LOTO as soon as possible allows field-service personnel to complete critical-path tasks in the compartment that normally would wait for a full LOTO. The obvious benefit is reduced outage time.
Yu next presented a best practice on a single-shift outage (23:50) piloted during a 7FA hot-gas-path inspection. It required about 14 shifts LOTO to LOTO instead of about 24 shifts (total of day and night shifts). Value to the customer included no plant support required at night, the inherent safety of not doing critical lifts at night, etc. No safety recordables or first aids were reported and there were no quality misses. There were several considerations an adopter of this best practice should be aware of. Get those details by accessing the recorded presentation on myDashboard.
In the final portion of the segment, Jeremiah Smedra, US West & Canada region manager (25:50), discussed progress on a so-called “event equation and standard work” introduced at the 2019 meeting. The equation: Success = Planning + People (field engineer + craft) + Customer Interface + Execution + Closeout. The presentation was delivered in two parts, separated by a short Covid Hero clip featuring Bayo Akomolafe (30:10) making 3D-printed face shields. If you recall the event equation and would like an update, access the recorded presentation.
The Houston Learning Center (HLC) and training video is fast-moving, answering many questions plant and maintenance managers likely have about FieldCore’s capabilities and offerings. Examples: How are FieldCore’s personnel trained? What are HLC’s capabilities? Can HCL train plant personnel in addition to GE/FieldCore personnel?
The first portion of the program, “The Training Center as a Competitive Advantage,” (00:20) takes you through the facility, which is equipped with the latest tools and a 7FA engine and is staffed by instructors with field-engineering experience. Trainees are taught how to lift casings, remove/replace bolting, etc, using the actual tools they would have in the field.
Rob Randall, FieldCore’s technical training director, began his presentation (08:45) noting that GE invests $50 million annually in the training center and its programs. The mission: “First time right.” The company’s strategy is to build and maintain a multi-faceted, highly capable workforce (11:20), blending college graduates, experienced hires, and internal promotions into a cohesive field-service team.
Specialized training is developed and conducted for specific tasks to ensure field work meets expectations. One such program described by Jim Rosen (19:15), HLC training director, concerned how to change-out first-stage buckets in 7HA gas turbines to meet an urgent fleet need. Everyone who would be involved in this work gained the knowledge required hands-on at HLC.
There was a timeout for a short Covid Heroes clip on how Ben Gilder (23:50), attached to the West Region, worked with a local distillery to product hand sanitizer for field-service crews.
The next segment (25:12) discussed competencies and managing them. It focused on driving consistency in the workforce by defining expectations down to the task level. A robust system is in place to track progress and personnel capabilities. Expectation is this will contribute to optimal crew selection for specific assignments.
A live Q&A session (28:00) followed with Randall, Rosen, and FieldCore Technical Competency Director Stephen Simmons participating.
The final prepared remarks (30:55) concerned flexible, custom-tailored training solutions available to meet the total plant needs of owner/operators. Currently, the GE/FieldCore training “engine” delivers about 1800 courses annually to 7500 customers in more than 50 countries.
Delivering capability begins with an overview of FieldCore’s “Covid-19 prevention field procedure” (00:50), a living document which continues to evolve based on experience. The final Covid Heroes segment of the day followed with Field Engineer Chad Locke (03:20) describing a sanitation upgrade—more specifically, a five-position bathroom trailer complete with hot running water.
FieldCore’s John Millacci (05:50) then reviewed the value of the company’s remote outage-support unit, a full-time global network of about three dozen experts at the ready to answer questions concerning O&M and other issues affecting customers. Field-service IT innovation was the next topic, valued for its fast ramp-up of knowledge and intellectual property required by field operations. Quality improvement was cited as one of the advantages of an interconnected workforce sharing information, contacts, best practices, etc.
“Maintaining competence,” a goal of GE/FieldCore, is enabled by a program called HLC+ which provides connections with experts, next-level on-the-job training, and meaningful network connections.
The remainder of the Day Eight program focused on building expert crews by thoroughly evaluating the skills of candidate personnel, and the tools available to assure consistently high-quality outcomes. A crew assessment score was explained. It is a single risk score for each outage that combines individually weighted risk factors to ensure the best crew mix for the specific site and scope. A crew-score simulator is used to identify the best fit for the job based on technology, customer site, etc.
GE University I, Day 11, July 14
For many attendees, especially those with O&M responsibilities, the first day of the GE University program likely was the most valuable. It touched on a wide range of fleet concerns, offering guidance on how to deal with specific issues. Access the presentations on myDashboard for exposure to the following:
Compressor, Francesco Colombo, compressor technical leader
-
- 7F compressor risk management. Incorporates a must-have table that highlights some of the “risks”—such as S5 root cracking, S17 wear/migration—the units most susceptible (flared, unflared), whether hours- or starts-related, applicable TILs for details, and how to mitigate the risk.
- 7F flared enhanced compressor options. Presents the highlights of various 7F flared enhanced-compressor options for Packages 2, 2+, 3, 4, and 5, plus enhanced R0, enhanced S0-S5. The new Robust S5 replaces the Enhanced S5 as the go-forward standard configuration of ECP3 and higher. Guidance also is provided on how to mitigate corrosion pitting, reduce excess water ingestion, etc.
- Flared 7F stator Row 5 events. Explains increasing risk factors and recommended mitigations.
- 05 VSV2 tip loss. Recommends inspection scope/interval (TIL-2167) and provides “what to do” ideas to mitigate tip rubs.
- 05 T-fairing wear. High hours on turning gear identified as a key contributor. Recommends inspection scope/interval (TIL-2122). Low-speed turning-gear solution offered to alleviate the issue.
- Non-OEM pinned stator experience. Multiple field events said to confirm increased failure risk associated with pinned stator mods. GE recommends replacing non-OEM pinned stators with GE parts.
Turbine, Mike McDufford, compressor and turbine fleet manager
-
- 7F AGP/7F.05 fleet experience. No simple way to summarize the information presented. If you have a 7FA.05 the slides presented might prove valuable. Provides general overview of 7F AGP/7F.05 hot-gas-path hardware condition at the end of an interval and fleet experience to date thus far
- TIL-2045, 7F AGP S3B tip shroud creep. Same comment as above. Overview of TIL-2045 and recommendation to implement S3S cooling. The S3S cooling solution has completed validation testing with test results showing a temperature reduction of about 100 deg F possible with shroud cooling.
- TIL-2181, S1N creep degradation model. Update software to correct settings (T-fire) so parts do not run too hot for too long.
- 7F AGP S1N cover plate observations. Issue background, probable causes, containment and corrective actions given.
- TIL-2156, 7F 2SN repair experience. GE improving S2N durability with innovative technology.
- TIL-2006-R2, 7F.03 “post-repair” root cause analysis. Repair processing has improved; follow this TIL to mitigate running risk.
Combustion, Erin Brennan, combustion fleet engineer
-
- 7F DLN-2.6+ center fuel nozzle tip crack. RCA efforts are on-going; slide in presentation gives details.
- 7F DLN-2.6+ effusion plate crack. Upgraded effusion plate with TBC scheduled for field testing in Q4-2020.
- 7F XAA liquid fuel. System cleanliness critical to operational success; exercise XAA every six months at least.
- 7F DLN-2.6+ axial fuel staging.
Rotor, Matt Ferslew, GT rotor principal engineer, and Jorge Orlandini, rotor technical leader
-
- Rotor preservation PSIB (product service information bulletin). Valuable reference. One user learned that not properly laying up his rotor during an extended outage required a shop visit to correct issues that could have been avoided.
- F-class rotor inspections are critical for assuring long-term safe and reliable operation of your gas turbine. Early planning is important to success.
- Operational considerations and maintenance cost implications. Download a copy of GER-3620N for guidance. You can access with a simple Google search. Be sure the version you download is “N,” published in October 2017. It has the latest equations for starts- and hours-based factoring. Be aware that operational factors can have significant impact on rotor-life inspection requirements and maintenance costs. A table presented is illuminating in this regard.
- Flat slot bottom and turbine-wheel inspection observations. Inspections completed to date have confirmed the OEM’s recommendations in technical information letters. TIL-1971 units (F.01 and FA.01) are showing challenges to achieving 5000 factored fired starts, inspections required to determine true rotor capability. TIL-1972 capability depends on operational specifics and the actual initiation of any wheel cracks in FA.02/.03/upgraded FA.04 units.
- Rotor life-extension observations. Access the presentation and review the photos and drawings in the slides pertaining to this bullet point, and the one below. It’s not possible to describe all the things you should be aware of in a few words.
- Recent/current rotor investigations.
- Rotor life management options. Critical to success is early planning—two years before a major that will be conducted between 96k and 144k factored fired hours or 2500 and 5000 factored fired starts.
GE University II, Day 12, July 15
Operability
-
- AutoTune evolution, Dave Boehmer. This presentation reviews terminology and associated documentation (GEK-121348, GEH-6740, etc). If you’re not up to speed on MBC, ARES, and ETS, access these slides on myDashboard.
- AutoTune troubleshooting guidance, Dave Boehmer. Tips and awareness for avoiding runbacks, shutdowns, trips, and emissions excursions.
- Combustor operability, Stephanie Queen, lead combustion fleet engineer. Focus is on how to improve or navigate tight operating windows is provided by way of a couple of examples. Suggestions are offered on how to prepare for a successful remote tuning experience.
- Monitoring and diagnostics, Karen Miller. What GE’s M&D Center in Atlanta does, how it operates, and what it tracks on your gas turbine are included in this presentation. It also provides examples of dynamics monitoring, exhaust thermocouple monitoring, performance-degradation analytic, impending-failure analytic, etc.
Accessories
-
- Gas fuel system reliability, Meg Lyman. Focus is on hydraulic oil varnish mitigation and the Parker servo-valve replacement option for Moog valves.
- Parts replacement lessons learned, Will McEntaggart, consulting engineer. Thinking of replacing that transmitter with a “smart” transmitter, or opting for third-party supplied thermocouples? Be sure you understand the risks regarding such things as temperature drift, response time, etc.
- Hazardous-gas system updates, Will McEntaggart, consulting engineer. Take the time to fully understand “improvements” to the aspirated haz-gas system to avoid spurious trips.
- Compressor bleed valves, Will McEntaggart, consulting engineer, and Chelsea O’Connor. Focus is on software protection and several best practices to improve CBV reliability.
- Air inlet system, Chelsea O’Connor. Reviews reference documents for O&M of inlet-air filter compartments, evap coolers, inlet-air duct systems, etc. Plus, TIL-2173 recommendations for a successful silencer panel inspection.
Controls
-
- Static starter reliability, Randy Ortiz. Identifies startup issues traced to 89SS, 89ND, 89TS, and 89MD switches; reviews Rev 3 of TIL-1755; reviews TIL-2219 regarding the prevention of LS2100e trip and 52SS breaker opening with no trip fault; discusses documentation and recommended maintenance intervals for LS2100 and LS2100e.
- Excitation system, Randy Ortiz. Breaker inspection and maintenance update; collection of data for engineering or user analysis; troubleshooting EX/LCI with capture buffers.
- Controls protection rationalization, Chris Cooper. Rethinking protection to improve reliability.
- Obsolescence, Charlie Straka. Thoughts on being prepared to avoid unintended outage delays attributed to ageing control components.
GE University III, Day 13, July 16
GE/Baker Hughes overview for controls
A few important points gleaned from this short presentation by Rob Turner, Mark VIe product manager:
-
- GE and Baker Hughes have 20 years of history working together in oil-and-gas and power-generation applications.
- The Mark VIe is GE’s controls platform for the future and Baker Hughes has access to that technology. GE remains the OEM for power generators and owns the Mark VIe technology, with Baker Hughes a strategic partner in this market sector.
- Baker Hughes continues to sell and service GE turbines in the oil-and-gas segment with Mark VIe control systems.
- GE account and service managers remain key paths for service and support for your units—including upgrades from legacy systems to Mark VIe technology, lifecycle planning for controls, post-installation services, etc.
- Notes of interest regarding control-system lifecycle status:
-
- The Mark VIe is the only gas turbine/steam turbine/DCS controls platform in production. All previous platforms (Mark I, II, III, IV, V, and VI) have legacy status.
- Regarding exciters for gas and steam turbines, the EX2100e is in production with the EX2100 having post-production status until 2021. Earlier excitation systems have legacy status.
- As for starting systems, the LS2100e is in production with the LS2100 having post-production status until 2021. Earlier starting systems (Innovation LCI and DOM+) have legacy status
-
Global repairs services
-
- Lean journey, Cameron Muhlenkamp, lean leader. A GE priority is to leverage lean to improve processes and eliminate waste. This presentation updates on actions taken and what’s ahead.
- Repair technology update, Camilo Sampayo, senior repair engineer. As the 7FA fleet matures, new pressures and repair needs are being identified and addressed. Repair costs are increasing because parts are ageing and new damage modes are coming into view. Examples of the latter include bucket slashface wear, thin airfoils from multiple repairs, deterioration of base and weld alloys, etc. Solutions summarized are 7FA.04 S2N heavy repairs and 7FA.03 S1B slashface restoration.
- Quality update, Charles Wilpers, senior quality A strategic focus for GE Gas Power is delivery world-class technology built on a foundation of quality, reliability, execution, and trust. A major focus this year is on improving GE’s customer communications along with its issue-resolution process. This presentation updates on those focus areas and the company’s quality roadmap.
Asset management
-
- Hot gas path, Louis Veltre, 7F product manager. Several slides speak to optimal repair migration paths and strategies and likely are of considerable value to anyone responsible for gas-turbine O&M—particularly at the fleet level. One of the messages is to capture cost synergies with already planned repairs and to focus your spend on value adders—such as improved coatings, improved sealing, optimized cooling.
- Rotor life management, Louis Veltre, 7F product manager. One of several presentations focusing on the rotor, this one discusses rotor maintenance strategies for increasing life potential and reviews end-of-life options—including repowering, upgrade, replacement, exchange, extend.
- Additional considerations, Louis Veltre, 7F product manager. Improving operational safety with a safety shut-off valve, increasing reliability with an electric gas control valve, increasing turndown with an overboard bleed system, reducing ongoing O&M costs with a robust exhaust frame, increasing the reliability of the liquid-fuel system (if installed) with water flush and other enhancements, etc.

Unit trips finally stop at Crete after relocating generator PTs—a 12-yr case history
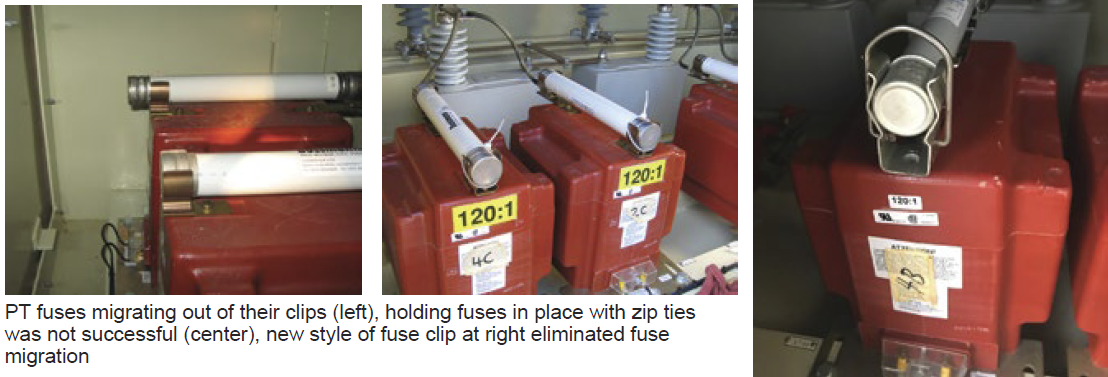
Since 2008, perhaps earlier, Crete Energy Venture, operated by CAMS, had been experiencing generator circuit-breaker trips and grid separation because of PT (potential transformer) fuse failures. Between 2008 and 2009, Unit 1 suffered eight PT fuse-failure events (nine total among the plant’s four 7EA peakers) resulting in 9.95 hours of forced-outage time and lost generation. Plant personnel noted during the investigation of, and recovery from, these events that the PT fuses were migrating out of their clips, and interrupting the circuit (photos).
In October 2009, a third-party contractor was hired to measure vibration on the Unit 1 generator, higher-than-normal readings having been observed on the exciter end of the machine. The contractor found that the second balance resonance vibration was high and vibration energy was being transmitted to the casing and extremities of the generator. The issue was resolved, so staff believed, by using a dynamic weight correction to the generator field (two planes). No PT fuse failures occurred in 2010.
In 2011 and 2012 the PT fuse-failure trips returned, with Units 2 and 4 having three failures contributing 1.74 hours of forced-outage (FOH) time. Site technicians attempted to zip-tie the fuses into the clips, given migration was noted on multiple fuses at the time of failure. This proved ineffective: Fuse migration was still observed during the 2012 fall outage.
Site personnel fabricated a new style of fuse clip with a latching bale mechanism and upgraded the fuses from 15 kV-0.5E amp to a more robust 15.5 kV-1E amp fuse with a protruding lip on the ferrule to prevent axial movement.
At this point the failures were so common that Plant Manager Brad Keaton’s staff had developed a recovery procedure using the MCB terminal blocks in the generator compartment and moving the failed fuse lead over to the second PT terminal of the affected phase to limit forced-outage time. Resistance was measured on all fuses during the spring and fall outages to see if fuse degradation could be tracked; fuses were proactively replaced. Only one failure was noted in 2013 on Unit 4 (1.27 FOH).
In 2014 three PT fuses failed—one on Unit 1 (0.35 FOH) and two on Unit 2 (1.42 FOH). A contractor was brought onsite in summer 2014 and the generator exciter end was balanced on Units 2, 3, and 4, where high seismic vibrations were identified during gas-turbine operation. After balancing, no fuse failures were noted for the remainder of 2014 or 2015.
In 2016 the fuse failures returned, this time exclusively on Unit 1. Over the course of a month, five more fuse failures occurred, resulting 4.49 FOH and significant lost revenue. Staff contracted a generator specialty group to collect flux-probe and vibration data during unit operation at varying real and reactive power conditions. A four-day maintenance outage was taken to disassemble both ends of the generator and perform visual inspections for possible dislodged rotor blocking or other mechanical issues.
Multiple test runs were performed with varying balance shots until vibration was reduced. Data were collected for the remainder of the summer peak season and sent for third-party review. There were no recurrences of PT fuse failures in 2016. The same vendor returned in March 2017 and performed a borescope inspection of the Unit 1 generator rotor. No issues were identified.
Two months later, Unit 1 experienced a PT fuse-failure event: Two of the six PT fuses failed while the unit was at base load, resulting in 4.4 FOH. Unit vibrations were low during this event and, having exhausted balancing and mechanical inspection efforts on the generator itself, staff shifted its focus to the line-side cabinet where the PTs were mounted.
An engineering firm conducted impact/resonance tests on the fuses, fuse clips, PTs, and cubicle. Transfer functions from the impact-response data were computed to determine the response as a function of frequency. Based on data taken during the resonance testing, three fuses had natural frequencies that were in close enough proximity to 60 Hz as to amplify their response to any generator vibration that might be present. A recommendation to install vibration dampening material under the PTs was implemented on Units 1 and 2.
Unit 3 experienced another fuse failure during the summer peak period. During the fall outage, plant personnel found the fuse resistances on all four units still shifted from 61 ohms new to 25 to 30 ohms at the time of inspection, with no difference noted in the units with dampening material installed. This was indicative of imminent failure based on prior experience; management determined a drastic change of approach was required.
Solution. In fall 2017, staff and a contractor worked on a plan to physically relocate the PTs from the line-side cubicle to another compartment where vibration would not be an issue. After considering multiple locations, the parties determined that the back side of the PACS generator circuit-breaker package would be an ideal location.
The vendor’s engineering and design department calculated there would be enough room to move the PTs to the new cubicle and maintain electrical clearances from phase-to-phase and phase-to-ground. The project was approved by owner Crete Energy Venture LLC and the full scope for Units 1 and 2 was planned for the outage in spring 2018. The relocation process began in April and was completed in nine days.
Next, primary injection testing was performed using the system back-feed as the source, with the GCBs closed and the generators for Units 1 and 2 completely isolated by removing a section of the non-seg bus between the GCB and the generator terminals. All voltages had the proper amplitude and phase angle at both the primary and secondary generator protective relays and controls system.
Results. In summer 2018, Units 1 and 2 had 125 combined starts with no PT fuse failures. Unit 3 experienced three PT fuse failures during the same period, re-enforcing the thought that the PT relocation had permanently resolved the issue. Plant management budgeted for and completed this project on Units 3 and 4 in spring 2019. Prior to relocating the PTs, there had been a total of 26 fuse-failure events totaling 25.09 FOH. In a total of 325 starts since project implementation, there have been no PT fuse failures.
Instrument-air system upgrades boost Crete’s reliability
Crete Energy Venture, operated by CAMS, battled issues with its instrument-air system and pneumatically actuated equipment for several years. Each of the plant’s 7EAs was supplied with an air compressor and dryer capable of producing only about 8 scfm of instrument-quality air. In addition to inadequate output, dryer operation was unreliable.
Performance issues also were identified with the inlet-bleed-heat (IBH) valve and the 11th-stage compressor bleed valves during cold weather. On multiple occasions the IBH air regulator (located on the turbine-compartment roof) malfunctioned because of moisture accumulation and its subsequent freeze-up on the diaphragm. This caused multiple runbacks and lost production.
The compressor bleed valves had caused several gas-turbine trips on shutdown. The trips were attributed to slower-than-expected operation of the valves, or a complete failure to actuate, because the porestone filter under the inlet section accumulated moisture which froze and restricted air flow to the actuators.
Plant Manager Brad Keaton’s staff determined multiple phases of improvement were required to adequately address the issues with pneumatic systems. In order to resolve cold-weather reliability issues, the IBH regulator was relocated into the accessory compartment. Necessary tubing modifications also were made—including vendor-provided heat tracing and insulation of the instrument-air tubing downstream of the regulator on the turbine-compartment roof.
The 11th-stage compressor bleed valve air-supply issue was resolved by piping instrument air to the solenoid-valve supply and removing the compressor discharge air and porestone filter from the system—thereby reducing the risk of freeze issues.
To complete the project and ensure an adequate supply of instrument air, four larger compressors and dryers were installed. The new, so-called AirCenter has more than three times the capacity of the original equipment and is equipped with an internal PLC, which is linked to the Mark V control system to provide alarm status.
Plant personnel then repurposed the old air compressors and dryers as a backup system which starts automatically when system pressure drops below a setpoint. All cable pulls, terminations, and tubing modifications were performed by plant personnel to minimize cost.
Results. Since project completion, the site has not experienced bleed-valve actuation issues, purge-valve failure-to-close runback events, and/or IBH air-supply issues over the course of 558 starts. On the two occasions where the new AirCenter malfunctioned, the backup compressed-air system took over and provided an adequate supply of air to operate all necessary pneumatic equipment reliably.
The man-hour commitment required to maintain a functioning instrument-air system has been reduced significantly because of the AirCenter’s high reliability. Staff continues to monitor and actuate air-operated devices at a greater frequency during cold weather to ensure proper operation.
Crete insulates demin tank, saves water
Crete Energy Venture, operated by CAMS, consumes from about 500,000 to 900,000 gal/yr of demineralized water for power augmentation (fogging) and compressor water washes. City water is demineralized onsite to 0.5 µS by a trailer-mounted system and stored in a 150,000-gal stainless-steel tank.
However, the tank was not insulated, requiring that it be drained before winter for freeze protection. Water remaining was considered “process water” and because Crete does not have a discharge permit it cannot be dumped to ground or a stormwater sewer. Disposal cost the plant was between $10,000 and $20,000 annually, plus an additional $10,000 in the spring to replenish the demin water supply.
Plant Manager Brad Keaton’s staff and a contractor developed a plan to insulate the storage tank with 2-in.-thick polyisocyanurate foam protected by an outer metal shell and to install two 7.5-kW direct immersion heaters to maintain the desired water temperature.
Another vendor provided heat tracing and insulation on system piping and instrumentation outside the tank. Plant personnel pulled cable for the heater power feed from a spare 480-Vac bucket in the electrical control compartment for one of the four 7EAs at the site and replaced the previously installed junction boxes and cable trays to accommodate the heater elements and heat tracing. The entire project was completed for $100,000.
This project allows Crete to hold demin water in the tank year-round. During the two winters since project completion, 167,000 gal of process water that would have required offsite disposal was retained in the insulated tank, saving nearly $60,000. Breakeven is expected after the 2021/2022 winter.
Hydrogen purge remote activation helps keep employees safe

Hermiston Generating Plant
Owned by Perennial Power Holdings and Pacificorp. Operated by Hermiston Operations Co.
500-MW, gas-fired, 2 × 1 7FA-powered combined cycle located in Hermiston, Ore
Plant manager: Brad Knight
Challenge. Provide an automatic remote means to purge a hydrogen- cooled generator without dispatching employees to the area.
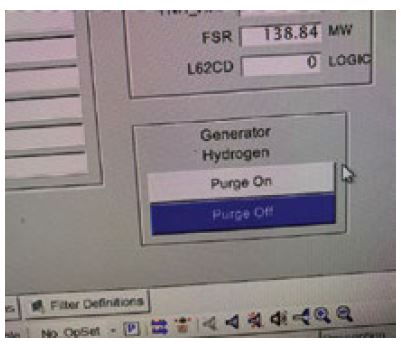 Many 1990s-era 7FH2 generators were equipped with an automatic purge system that activated when hydrogen purity at the seals dropped below a specified setpoint. However, the controls were located in the collector compartment and could not be safely accessed if a hydrogen leak in that compartment was suspected. In the event seal oil was lost it would be unsafe to approach the collector compartment to activate the purge. If the controls were left in maintenance for any reason there would be no way to activate the purge without endangering an employee.
Solution. Since the automation was already in place along with solenoid- activated hydrogen shutoff valves, hydrogen vent valve, and CO2 admission valve, all that was needed was to move the controls to the Mark V. Employees of Hermiston and TTS Energy Services, Orlando, Fla, modified control wiring and re-routed it to the Mark V. Because of the significant safety and liability concerns associated with hydrogen, a controls consultant was engaged to modify the Mark V logic and create a purge button to activate the purge from the Mark V HMI (photo).
Results. Now control room operators can monitor hydrogen purity remotely and perform a preemptive purge in the event they lose seal oil, without putting employees or equipment at risk. The total cost of the project was less than $10,000.
Project participants: Scott Rose, Tim Key, Jason Gefre
Personal ownership leads to 25 years of no lost-time accidents
Challenge. Provide a working environment where all employees can go home safely each night, without sacrificing plant reliability.
Solution. Instill a culture with a sense of ownership for the plant and for the safety of the people around them. Hermiston Generating Plant as been owner-operated by Hermiston Operations Co since COD. The facility’s 50/50 co-owners, PacifiCorp and Perennial Power, are heavily invested in providing a safe working environment. HOC has been successful in inspiring employee ownership by doing the following:
-
- Investing $75,000 annually in employee safety and technical training.
- Developing safe work habits by hiring locally and training employees from the ground up.
- Handling significant decisions concerning safety, maintenance, operations, and accounting at the plant level.
- Spending time as a team—including team members’ families—at company-sponsored barbeques, safety events, and gatherings.
- Maintaining a highly active safety committee, managed and operated at the plant level.
- Empowering employees to stop any job, at any time, if they feel it is unsafe.
- Recognition from the owners through emails and awards.
- Investing in engineering controls, such as these:
- Automating the air-ejector skid to minimize ladder
- Relocating local instrumentation to ground
- Automating the hydrogen purge skid to be activated from the control
- Building safe working
Results. Hermiston Operations Co has achieved the following:
-
- Started its 25th year Nov 1, 2019 with no lost-time accidents.
- Was recognized as a SHARP graduate in 2005.
- Has a five-year average EFOR of 0.86%.
Project participants: All plant personnel
Maintenance, outage file-sharing boosts productivity at four peaking plants
Challenges:
-
- Downsizing of planning staff created a backlog of outage/maintenance planning and scheduling tasks.
- Personnel at the Kearny, Burlington, Linden, and Essex peaking sites had to communicate together in real time.
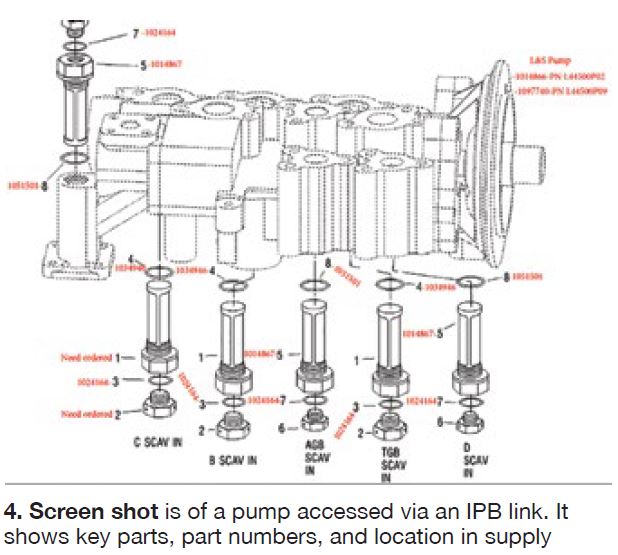
- Needed a way to consolidate all reference materials, procedures, IPBs, drawings, and schedules for use by O&M personnel in real time. The existing system relied on multiple platforms and computers and was not user friendly, causing delays in the completion of tasks.
- Transition from hard-copy and paper to a digital platform, but retain the capability to use both.
- The cost for a contractor to build the desired platform, and consolidate the necessary files, was prohibitive.
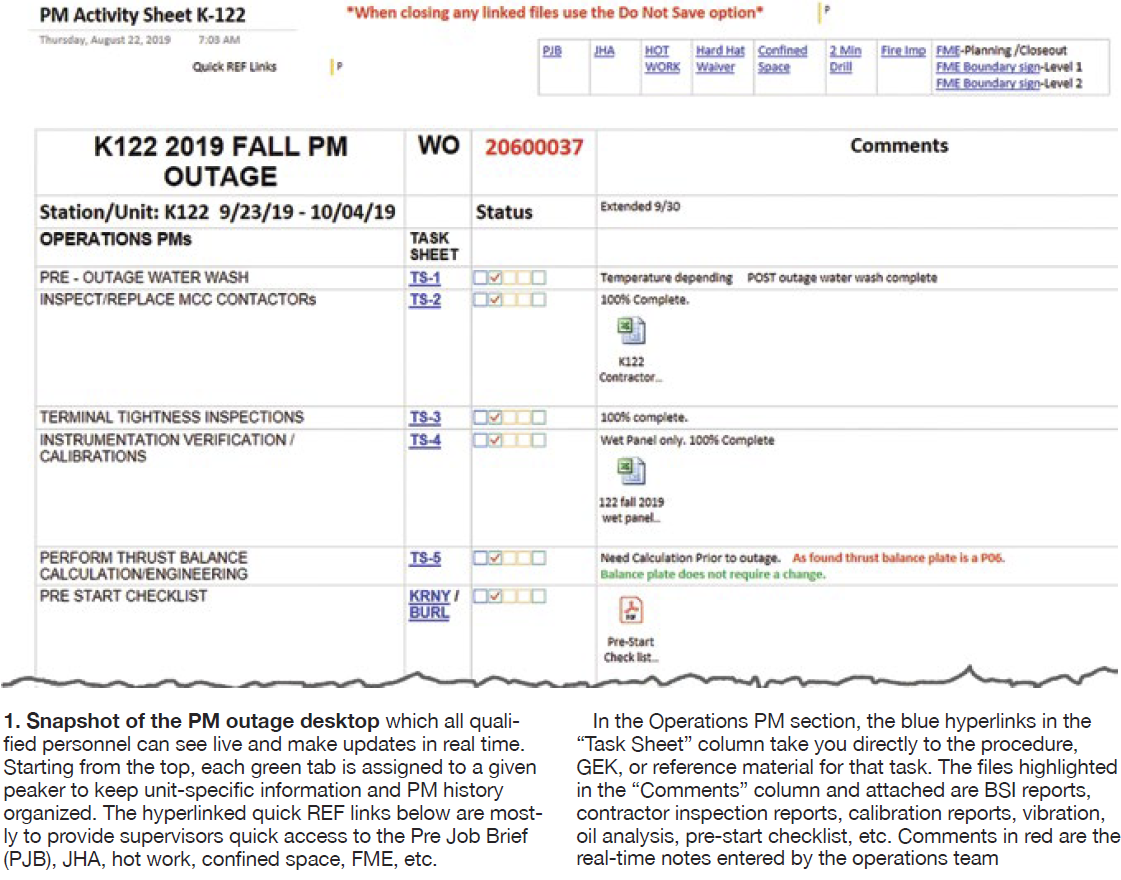
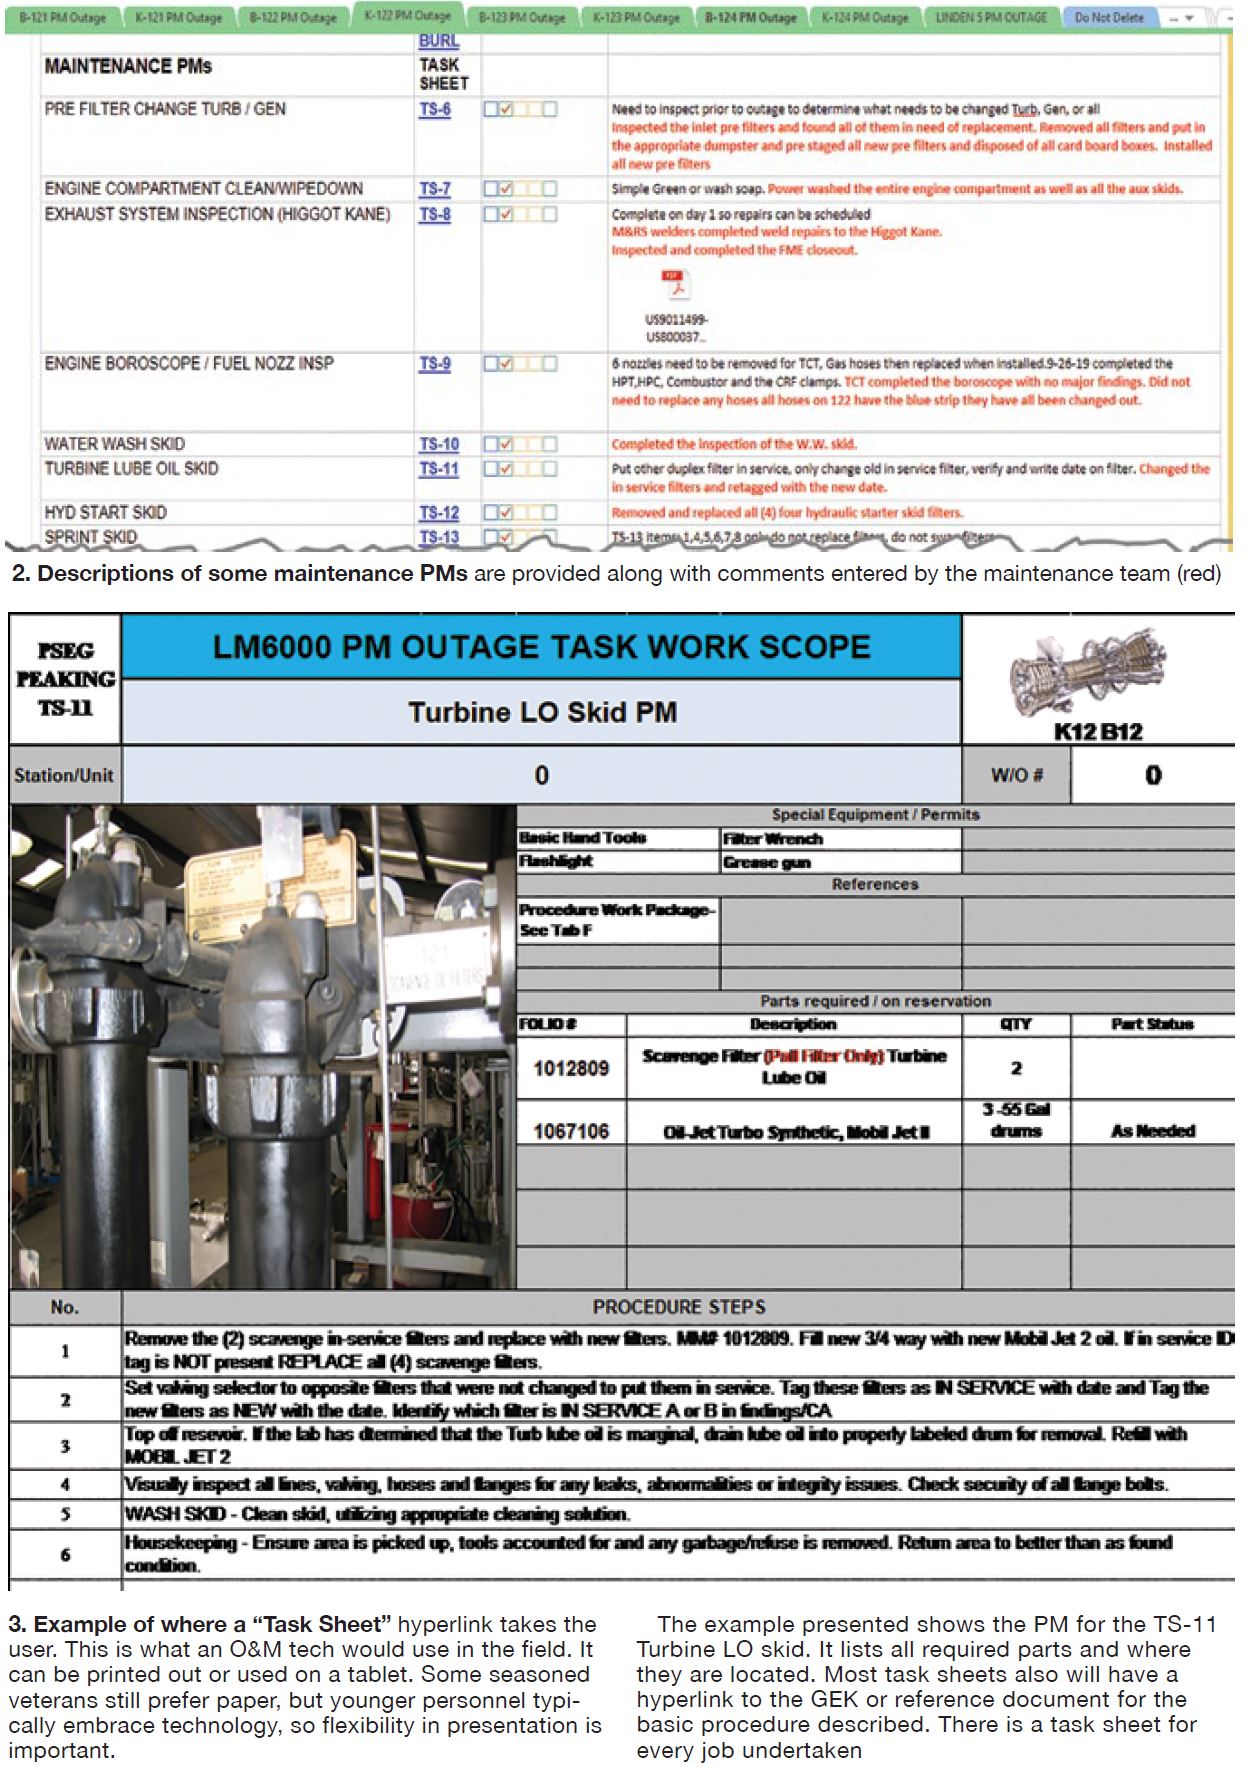
Solution. Use off-the-shelf software, OneNote, included free with Microsoft Windows already installed on PSEG’s computers. Training was free as well, and fast: It took only about two hours to become proficient on OneNote using a YouTube program.
The software runs on and uses PSEG’s shared drive, located behind the company firewall, so everything is safe and secure.
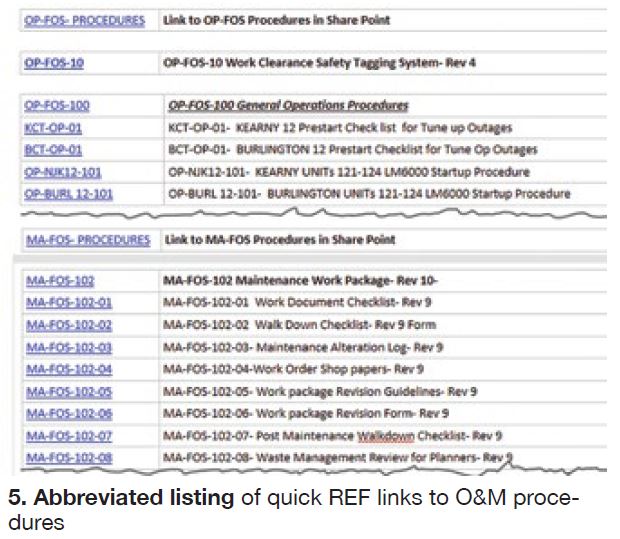
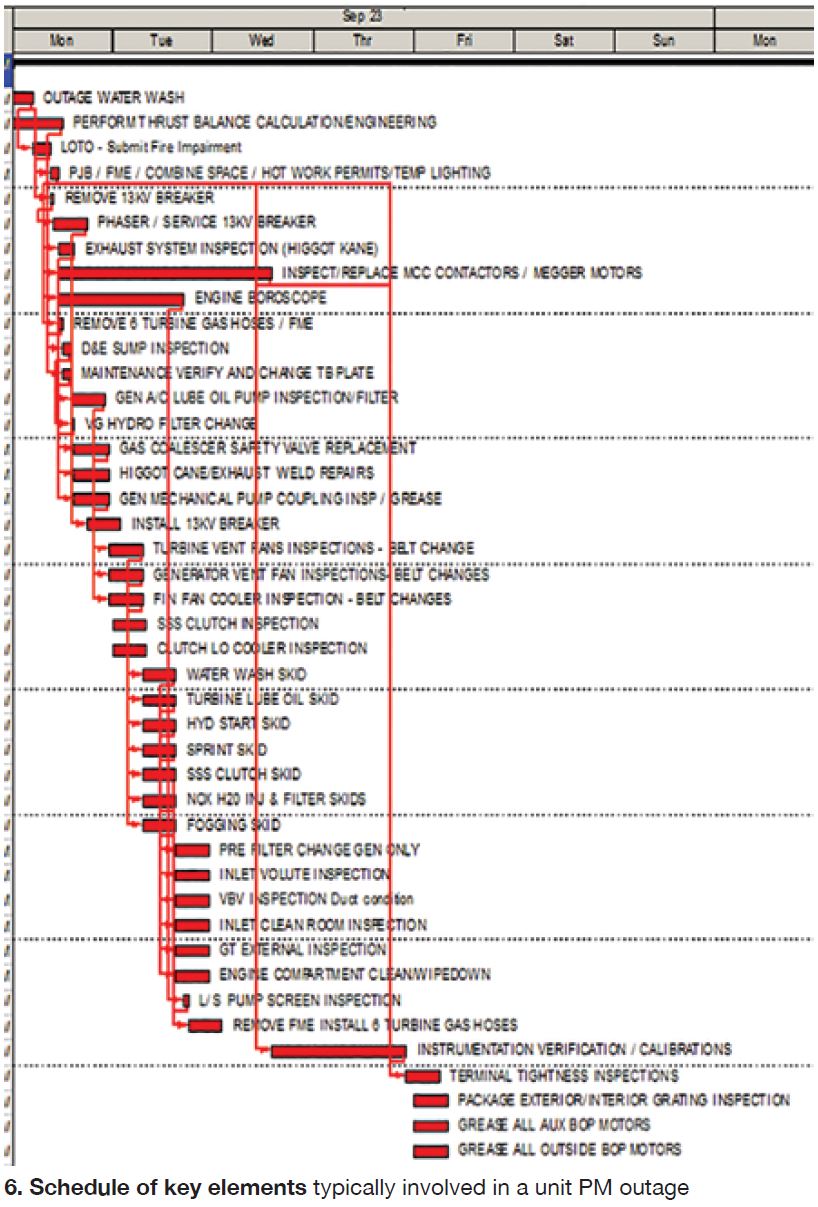
Results. OneNote has been well-received by staff. Its capabilities are summarized in the illustrations.
Project participants: Al Van Hart, Ron Eilers, Clint Bogan
PSEG’s peakers
Kearny Generating Station: 456-MW, dual-fuel, 10-unit simple-cycle peaking facility located in Kearny, NJ, and powered by GE LM6000 PCs
Burlington Generating Station: 168-MW, dual-fuel, four-unit simple-cycle peaking facility located in Burlington, NJ, and powered by GE LM6000 PCs
Linden Generating Station: 350-MW, dual-fuel, four-unit simple-cycle peaking facility located in Linden, NJ, and powered by GE 7EAs
Essex Generating Station: 81-MW, dual-fuel, one-unit simple-cycle peaking facility located in Essex, NJ, and powered by a GE 7EA
Turbine Tip No.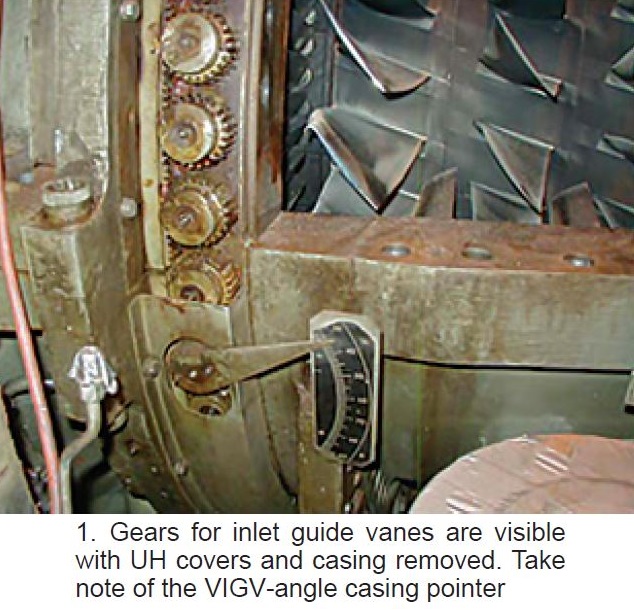 8 from the PAL Solutions Library applies to General Electric 5001N, 5002B, 6001B, 7001B-EA and F, and 9001EA and F gas turbines. It is the work of Dave Lucier and Charlie Pond (deceased) of PAL Turbine Services LLC.
Proper operation of compressor variable inlet guide vanes (VIGV) is crucial for those gas turbines that have the “variable” design. Hundreds of components comprise a VIGV set and all must function properly and in unison. The operating cylinder must stroke; the rack must rotate; the vanes must all turn together to set the proper angle in the compressor inlet air.
Should a vane gear bind and not rotate properly or should one of the blades rub on the internal side of the compressor inlet casing (bellmouth), the consequences could be catastrophic. If a vane breaks off and liberates, it would be ingested into the compressor and cause 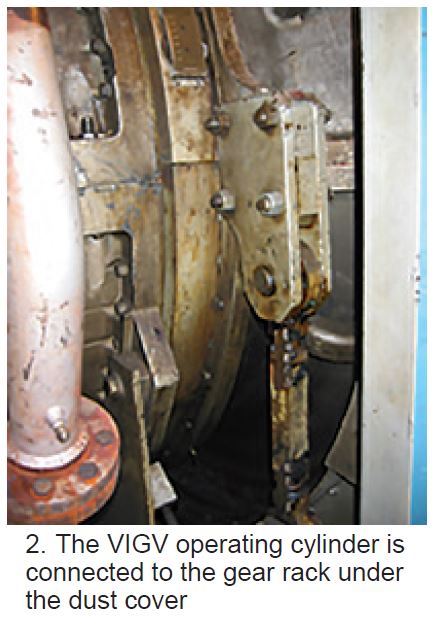 the rotating and stationary blades to fail as well. Bad news!
The VIGV set must rotate freely from the so-called “closed” to “open” position and back, depending on the turbine starting and operating design. End stops allow vane rotation through an arc of approximately 45 degrees. Free-moving vanes are vital to the proper startup, operation, and shutdown of the unit (Figs 1 and 2).
The closed, or starting condition, is set to reduce air flow during startup. This is done to mitigate compressor surge as the shaft speed and air flow increase. The VIGVs return to the closed condition during the shutdown sequence to again mitigate surge (vibration) and to prepare for the next start attempt.
During startup, as the turbine approaches operating speed (about 95% of rated speed), the VIGVs are signaled to rotate toward the open position. On most turbines, this means an angle change from approximately 44 to 87 degrees.
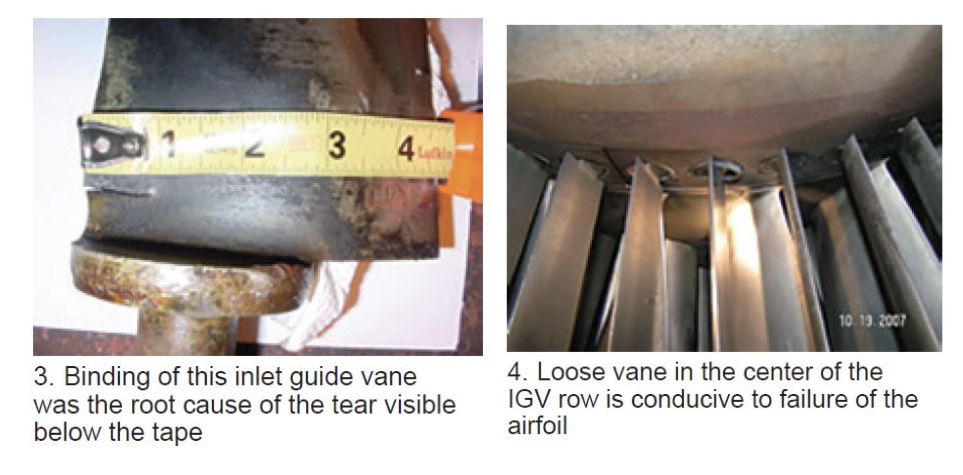
Fig 3 illustrates what can happen if a vane gear or bushing binds. The tear in this vane is about three-quarters of an inch in length. If the vane fails and eventually liberates, it could be sucked downstream and destroy compressor rotor and stator blades. A loose vane bushing also can cause a vane to bind, break off, and liberate (Fig 4).
Periodic testing of VIGV operation—quarterly recommended—can help identify potential issues before they morph into a problem and damage the unit. Here’s a typical procedure for testing the VIGVs on turbines with motor-driven hydraulic supply pumps:
-
-
- Confirm that the ac lube-oil pump (88QC) is operating and in the manual control mode. Recall that this pump feeds oil to the suction side of the hydraulic pump.
- Operate the ac hydraulic supply pump (88HC) in the manual mode to provide 1200-psig oil to the VIGV operating cylinder. Important: The 5001N engine has no 88HC, so a temporary hydraulic pump must be used. There is a pressure tap in the hydraulic manifold where a plug can be removed and the pump line installed. A check valves prevents back-flow return to the lube system.
- Force the logic or simulate the pickup of speed relay 14 HS. Normally it is energized at 95% turbine speed.
- Verify that 20TV is energized, so the VIGVs can move to their fully open Energize and/or de-energize the solenoid and observe the action, back and forth, closed to open. Be aware that some turbines have a solenoid valve called 90TV. One or the other is used to actuate the VIGVs between end-stop positions.
-
Logic-forcing methods will depend on which Speedtronic™ generation is applicable—that is, techniques will differ depending on whether the control system is a Mark I, II, IV, V, or VI. Recall that there is no Mark III system.
-
-
- Measure the end-stop positions of the VIGV (open and closed) with the pointer on the IGV ring and scale on the lower half of the compressor forward casing (refer back to Fig 1).
- Confirm the movement by measuring the voltage change of the linear variable differential transformers (LVDTs) associated with the travel of the VIGV hydraulic cylinder.
- Put eyes inside the compressor inlet casing (bellmouth) during the test to assure the vanes are all turning correctly in unison and not binding.
-
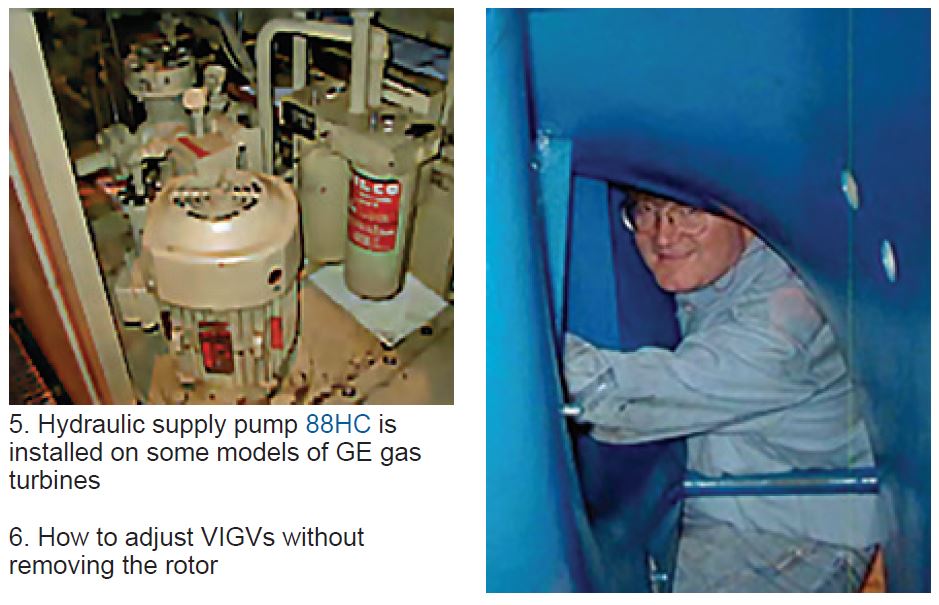
If binding is observed or suspected after several stroke cycles, a thorough borescope inspection may be required. Pond and Lucier LLC has developed a technique for servicing VIGVs without rotor removal (Fig 6). The service is offered at a firm price within a two-week window.
Goal of an integrated powerplant knowledge platform nearly reached

Twenty-five years ago, at least one powerplant controls company executive articulated a vision of integrating disparate and siloed software applications into a unified whole, anchored by the distributed control system (DCS). That executive was Robert Yeager, long-time president of Emerson’s Power and Water Solutions. At the company’s 2020 virtual Ovation Users’ Group Conference (OUG), it became clear that Yeager is tantalizingly close to achieving that vision.
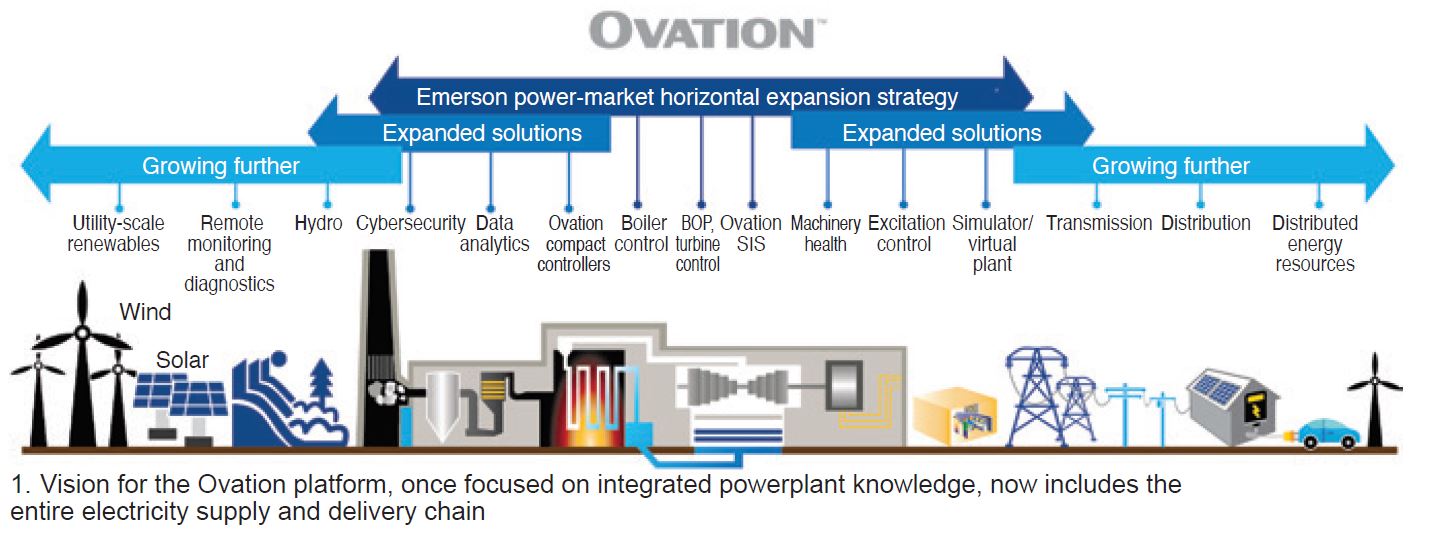
“We are no longer just a distributed control system company,” Yeager said in his traditional opening remarks. “With the continuous evolution of our Ovation automation platform, we are a protection and condition monitoring, failure prediction, excitation, simulator, advanced monitoring and diagnostics, data analytics, advanced visualization, and a PLC (programmable logic controller) company.” For that matter, today the vision for Ovation platform now encompasses the entire electricity supply and delivery chain (Fig 1), not just the powerplant.
Indeed, not only is the Ovation platform all that, it has also become the gateway for services and expertise provided from, well, anywhere. This capability was certainly stressed-tested in the last few months as Emerson and its customers grappled with a COVID-19 ravaged landscape.
Most digital-system experts would agree that perhaps the greatest threat to Yeager’s vision would be something impossible to envision back in the mid-1990s: cybersecurity. To mitigate that threat, over the past few years, Emerson developed capabilities, native and through strategic partnerships, such that Yeager could also say, “We’re a cybersecurity company.” One that works on other vendor control systems, to boot.
Major OUG themes on Yeager’s mind this year included the following:
-
- Challenges associated with a shift toward renewables and maintaining business continuity during a global pandemic.
- Emerson’s acquisition of American Governor, which brings hundreds of hydroelectric sites into the user fold.
- Expanded relationships with turbine OEMS, such as the recently announced collaboration with Mitsubishi on power industry digital transformation.
- Implementation of IEC 62443, the latest cybersecurity industry standard.
- Expanding the Ovation platform’s footprint to include T&D and distributed energy resources.
- A virtual repair and enhancement center anchored by the “live” version of the Ovation digital twin simulator.
These were expanded on in the follow-on presentations.
Regarding the last and, frankly, profound piece of the puzzle, Yeager encouraged the audience to think of the repair and enhancement center as a “repair shop, saying: “Drive in if you have squeaking brakes, or your check-engine light is on.” As a directly relevant example, Yeager said, “suppose you have too many alarms (or check-engine lights) on, bring your ‘plant’ into the shop, we’ll fix your alarms, and you can upload the changes during your next outage!”
Users catch up to vision
In evidence every year at the OUG, and expected, is that the “facts on the ground,” or “in the field” in this case, are a few years behind Yeager’s vision. One user who commented live on his plant’s experience with the digital twin said it was primarily used for training. “Operators don’t get much opportunity to train on abnormal situations, and the simulator is close to what they would get in a real situation.”
Yeager noted that there are hundreds of digital twins now in service. In a later presentation devoted to technology, VP Software Solutions Rick Kephart said they were working with beta sites now on tools to keep the Ovation simulator up to date with the changes in the actual control system, and that “we are looking at a few pilot projects to achieve the ‘holy grail,’ synchronized simulation,” or an authentic live digital twin.
Necessity is. . .
. . .the mother of implementation, to twist a time-worn phrase to fit the COVID-19 period. The virtual meeting applications, networks, and bandwidth to do things remotely, like Ovation training and factory acceptance tests (FATs), have been available for years. But it took a pandemic to show how ready these capabilities were for not only prime time, but all the time.
Working collaboratively with their customers, the Ovation project team shifted from 5% of FATs being done remotely pre-COVID to over 90% as the virus raged across the country. People familiar with that popular self-help/management book “Who Moved My Cheese?” will recognize the project team’s achievement as akin to moving the state of Wisconsin.
Jaime Foose, director of security solutions and lifecycle services, during the part of the program devoted to services, noted that “educational services have seen a dramatic shift to virtual classes, and yet we’ve managed to maintain a 95% customer satisfaction rate.” The services team experienced a reduction in calls from customers, so Emerson proactively called them to offer assistance.
The digital twin sets the stage for the Ovation platform to provide even more services virtually and remotely. Nevertheless, Glenn Heinl, VP North America lifecycle services, anticipated during the Day 2 Q&A that “[the fall] will be an outage season like Emerson has never seen. Approximately 2500 days of Ovation field services were postponed from the spring outage season to the fall and we’re tapping into all of Emerson’s North America and worldwide resources to provide support.”
Yeager mentioned during the opening that 70% of Ovation’s field engineers are still traveling to sites, “even sites with COVID-infected staff.” More than 2500 onsite service days were provided from March through July. At headquarters, Emerson put a COVID preparedness team in place in early March, with one tactic dividing the HQ staff into A and B teams, with half the staff coming in one week, the other half the next week. Yeager called the onsite customer and Ovation teams “heroes.”
Deck plate solutions
The Power Industry session covered specific solutions important to combined-cycle (CC) plant owner/operators.
Bearings. Jason King, manager of machinery health solutions, revealed embedded condition-monitoring (mostly vibration) features within the Ovation platform that now allow monitoring of bearing alignment, turbine balance, and bearing wear, as well as a specific bearing-rub advisory. Vibration analysis is one of the most effective condition-monitoring technologies available, and automation of analysis for turbomachinery greatly improves return-on-investment by allowing users to plan maintenance in advance, reducing forced outages and O&M spend. These features are now in beta test at one site.
On the screen, as one example, the operator sees a “Q factor” for journal-bearing wear, a Q less than or equal to 4 means wear is not indicated, between 4 and 6 means repair at the next outage, and a value between 6 and 8 means repair now. Conveniently, the monitoring values from the Ovation system can be directly tied into the CMMS (computerized maintenance management system) to automate work flow (Fig 2). “This is just one more step towards the autonomous plant,” King concluded.
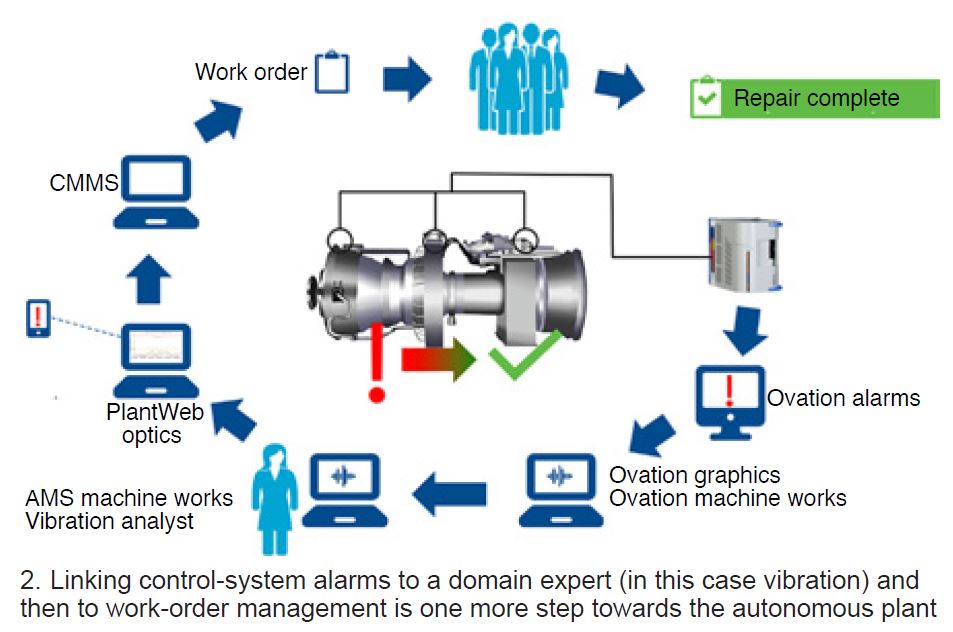
King also introduced features included in the release of the latest version of Emerson’s new advanced vibration analysis software for use with Ovation Machinery Health Monitor, called AMS Machine Works.
Generally, the Ovation Machinery Health Monitor is an eight-channel vibration module compatible with existing field sensors for the steam or gas turbine/generator and other critical rotating equipment.
Steam bypass control. Jim Nyenhuis, manager of performance consulting, covered a solution near and dear to CC owner/operators running high-starts units: steam-turbine bypass control. Specifically, the Ovation platform now includes an advanced bypass-control and steam-temperature application employing model predictive control (MPC) techniques. The actual control-system responses are constantly being compared to the model, and the system automatically adjusts accordingly in real time.
MPC has demonstrated that it can greatly reduce variations in steam-temperature control (Fig 3).
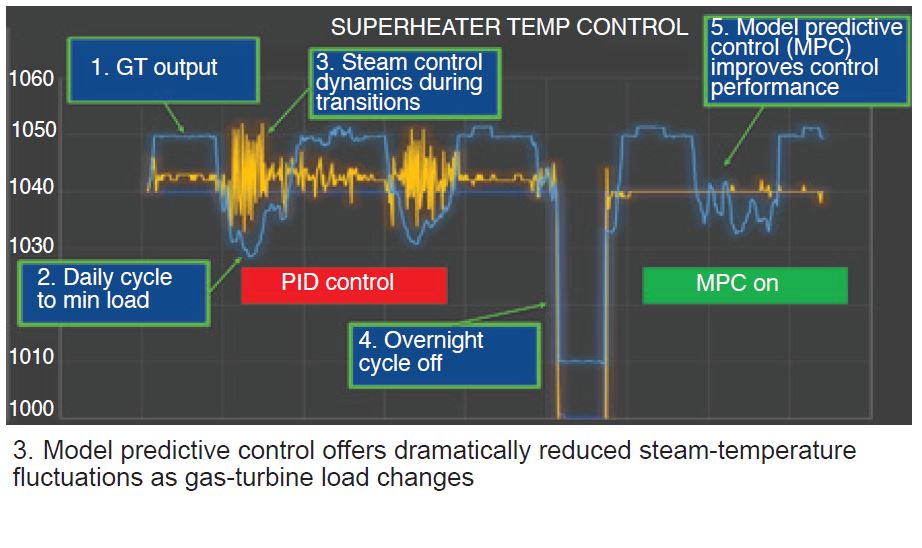
Attemperators have common installation issues, Nyenhuis continued, such as water leakage past the control valve seat, plugged nozzles, improperly sized water droplets, and localized quenching. These problems can be traced back to rapid changes in thermal energy from water injection, but the resulting time lags in energy changes impact the ability of the control system to do a good job.
In many cases, gas-turbine load reductions stress the attemperator, but even at full GT load, the attemperator can cycle between 0 and 30% of capacity if control dynamics are not managed properly. Advanced control often reveals the limitations of bypass control equipment that is improperly sized.
In the real world, operators usually don’t have a good measurement of bypass steam flow. However, by running the live digital twin in lockstep with the plant’s control system together with advanced pattern recognition (APR), the system can provide a “virtual sensor” proxy for steam flow, which in turn can be used in a more robust control strategy.
Faster starts. As gas turbine and CC plant operators respond to renewables, faster starts are necessary to take advantage of new market mechanisms like fast frequency response. Laurence O’Toole, manager of gas turbine solutions, delineated several techniques to achieve faster starts:
-
- Advanced steam-cycle control can minimize mechanical stresses on the HRSG during rapid CC unit startups.
- Logic added to the startup sequence for 7EA machines called fast premix transfer can take full advantage of the purge credit and increase load ramp rates from 4 to about 14 MW/min (Fig 4). Fast premix transfer allows the turbine to fast start by staying in Lean-Lean mode until base load and subsequently transferring to premix mode while at base load.
- Integrating PSM’s Autotune solutions into the Ovation controls, for which testing is now complete, with 10 units expected to be installed over the next year—the first in the US by the end of this year.
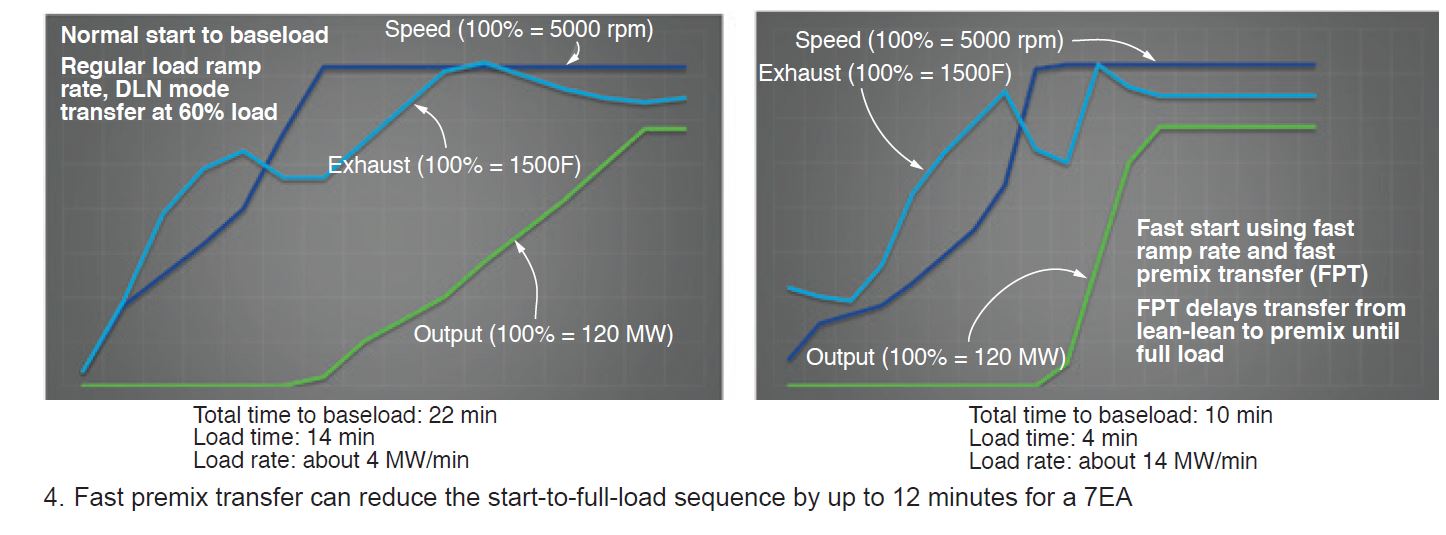
Coming enhancements include an online test for MOD-27 frequency response, the NERC standard ensuring that turbine frequency/MW response is accurately modeled for grid compliance. APR built into Ovation will provide shorter-term equipment trend conditions based on the high-speed data rates available in the platform.
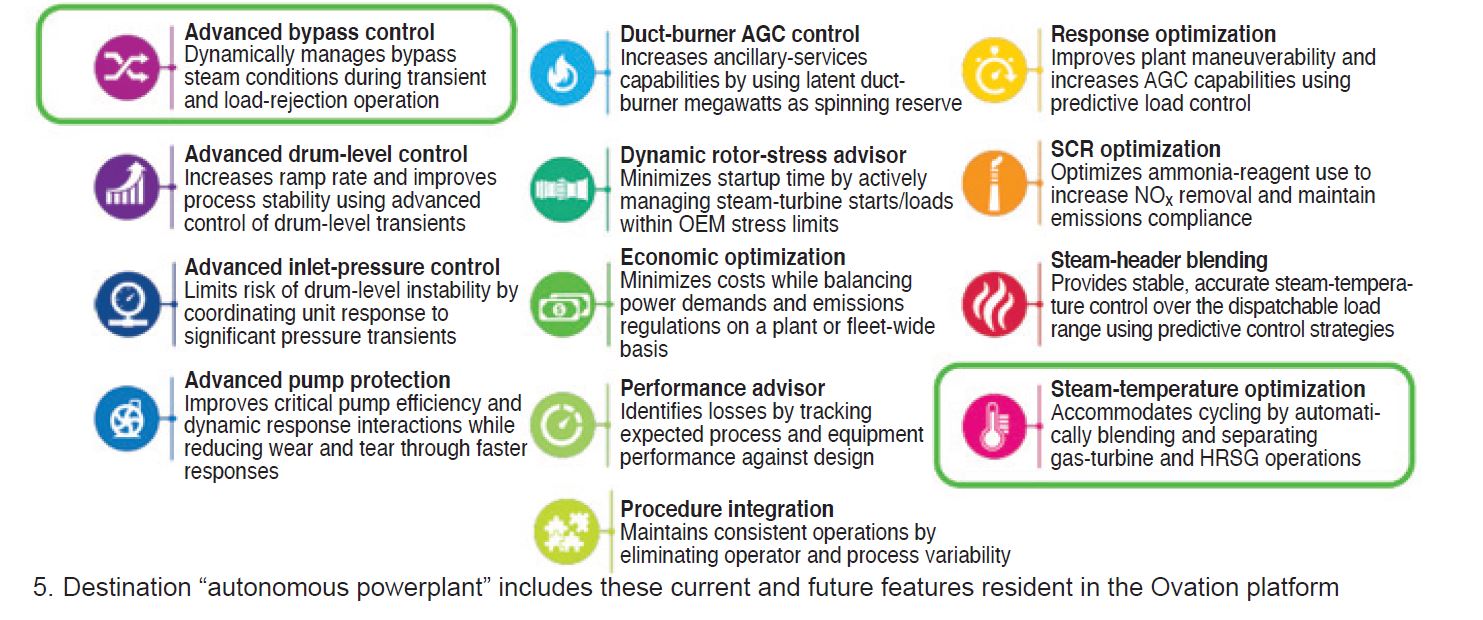
While these three performance goals were the subject of presentations, they are only a few of the advanced power solutions being made available through the Ovation platform (Fig 5).
Ovation Users Group Steering Committee
President, Keith Nelson, Mississippi Power Co
Vice President, Carl Bayley, Xcel Energy
Secretary, Shawn Hawley, Hampton Roads Sanitation District
Outgoing President, John Maloney, Evergy
Bill Collins, Exelon Generation
Joel Erwin, Luminant Engineering Support
Dan Jones, Evergy
Jeff Majka, Metropolitan Water Reclamation District of Greater Chicago
Dave McMullan, Xcel Energy
Daniel Noles, Tennessee Valley Authority
Jim Rarey, American Electric Power Co
Wes Whitley, Alliant Energy
Scott Woodby, Midland Cogeneration Venture
For the Ovation geek
Much of Day 2 of the OUG was devoted to the nuts and bolts of Ovation technology advances, generally the purview of the I&C specialists.
VP Technology Steven Schilling started by reminding the audience that what drives Ovation development are “smaller islands of control over wider geographical areas, larger system capacity, and deploying controllers in remote areas using existing networks.”
Kephart and Roger Hughes, director of global hardware engineering, went deep into the characteristics of Ovation’s scalable controller technology (Fig 6), starting with the OCR1100, a dual-core machine now with 2× to 3× higher processing speed, while maintaining 100% backward compatibility with earlier Ovation versions.
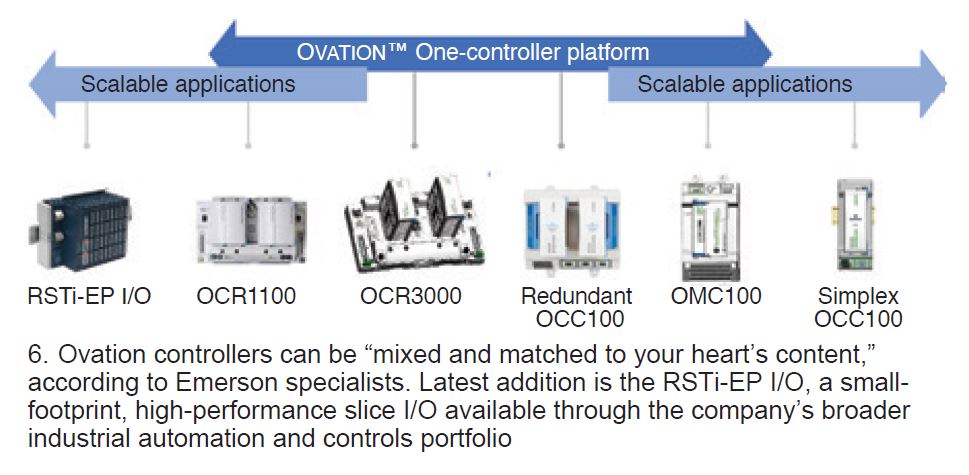
Emerson soon will be introducing the OCR3000, the next generation of its “flagship” controller, according to Kephart. “Both controller families have similar capabilities, but footprint and capacity are the distinguishing features.” Consistency is maintained between the two families of controllers.
The OCR3000 features quad-core technology with 3× to 4× higher processing speeds (depending on the applications running), and network connections available on the backplane to make it “plug and play.”
Ovation also teased its answer to a PLC, a new micro-controller that initiates a secure virtual private network (VPN) between routers, “effectively eliminating separate routers at local remote sites,” according to Kephart, “and reducing the number of moving parts.” Essentially, you get PLC I/O on a DCS platform, he added.
Hughes lauded the very small form factor of the I/O in the controller and noted the flexible user configurable I/O built into the design. Standard Ovation tools familiar for remote I/O are available. For example, Kephart noted that you can plug in a laptop and make changes locally.
The stand-alone version includes what Kephart called “lightweight engineering tools” based on Windows 10, a temporary database server running SQL, and an HMI available locally or from a laptop. Applications are housed in the controller itself.
Moving on to the digital twin, Kephart called it a “mature” and proven product, that now includes integrated simulation with tools that reconcile the Ovation simulator with the production or plant control system without disruption, all “being worked through beta sites right now.” He called synchronized simulation, or live digital twin, the “holy grail” for which Emerson is now evaluating a few pilot projects.
Operator assistance gets really interesting when you combine the live digital twin with the Ovation Process Analytics Studio. Live simulation can be used to locate sensor failures while providing replacement data. “It’s like a modern automobile when the driver swerves into another lane and the control system guides it back. The system can recognize impending equipment failures and respond accordingly, or provide expert guidance about how operators should respond.”
The analytics applications are fed data from the Ovation process historian which incorporates an asset hierarchy replete with failure modes and effects analyses (FMEAs). The controllers are so powerful and fast now that APR functions (also called machine learning technology) can reside on the controller, sort out poor signal quality and bad data, and provide sensor diagnostics. This gives a cleaner, high-speed data set which can be inputted to higher level functions at the M&D center, or used locally.
“Think of it as your iPhone applications,” Kephart suggested, “and the apps don’t even have to be from Emerson” (Fig 7). The practical way to visualize all of this is to realize that all of the functions—such as predictive analytics, thermal performance monitoring, alarm management, and process optimization— hanging off of, say, a siloed data historian in many powerplants, can now be run faster, cleaner, and more secure as part of the Ovation platform.
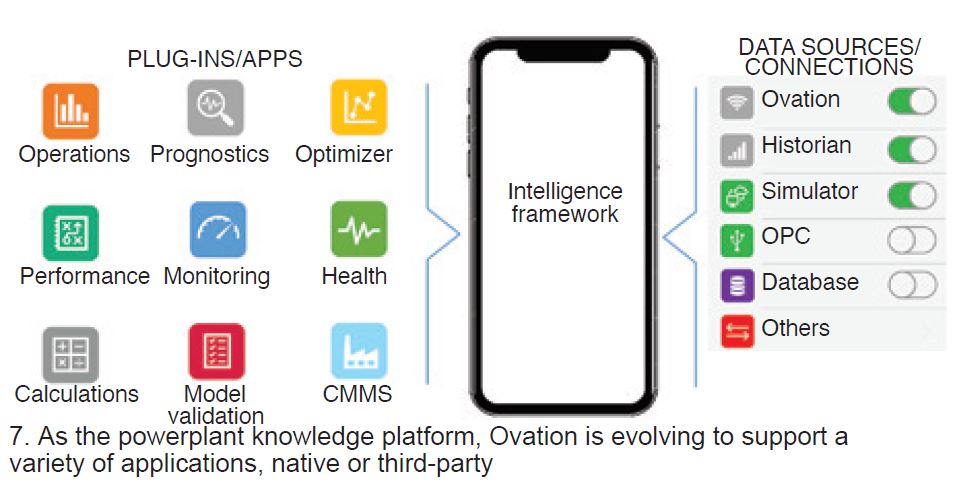
And more plug-in applications are in the pipeline, says Kephart. One example is a performance monitoring tool for control loops. “We can calculate and present a real-time ‘health score’ for each control loop,” Kephart said.
And just to make sure the audience knew it was in Jetsons’ territory, Jaime Foose tantalized the audience with a reference to an augmented reality technology that allows anyone (especially Emerson services staff) to provide direction to the plant through the screen. The technology is now being piloted in the Emerson central service region for external customer support, and is perhaps the finest example of how COVID-19 has forced everyone to reconsider how technology can be harnessed to get work done and keep the lights on during these abnormal times.
Insights from Q&A sessions
After the presentation of the Emerson facility awards (congrats to University of Texas at Austin and its campus microgrid project for winning the innovation award!), Day 3 was devoted to a lengthy Q&A session, with many questions from users unsurprisingly focused on COVID- and cybersecurity-related issues.
One could imagine that the audience breathed a collective sigh of relief when the Emerson team said that there had been no impact on customer support from COVID travel restrictions.
To a question about NERC cybersecurity alerts, the Emerson team responded that they monitor the alerts on a daily basis and respond to customers within 24 hours.
Users also had many questions about controllers, such as: Can the OCR3000 be used in the same network as the OCR1100? Answer: Yes, and also the OCR400; you can mix and match “to your heart’s content.” The flash card in the OCR400 has been replaced with an industrial-grade compact flash storage device, which can be formatted in place. This, to Emerson, is a more reliable solution because you don’t have to remove flash devices.
Two questions on renewables and grid storage systems elicited that Emerson is responding to many inquiries for battery and energy management systems from engineering firms and that H2-based system inquiries are growing. Emerson now has several combined PV solar + battery projects under its belt. Ovation systems now control approximately 3000 MW of solar in North America and Emerson has put in place strategic partnerships to address optimization and obsolescence issues with control systems at legacy wind facilities.
One user asked about lead times to replace old GE excitation systems (in this case, for a 200-MW unit), something clearly on the minds of many in the GT user community, and the answer was lead times vary based on the type of exciter being replaced (whether it is rotating or static), existing space considerations and the bridge size required to meet the generator specific needs.
Finally, responding to a user concerned about the transition from OCR1100 to OCR3000 controllers, Emerson said the upgrade would be straightforward, 100% compatible with existing Ovation hardware and software, and lead to faster processing speeds and lower power consumption. Because the “base is 100% compatible with the old base, it’s basically a swap out.”
Out of adversity. . .
. . .comes opportunity, or so they say. Last year, Jim Nyquist, Emerson’s group president for systems and solutions, opened the OUG by proclaiming this to be “the most challenging environment in history for power and water.” Twenty-twenty has likely eclipsed 2019 in the challenge category, but COVID will undoubtedly prove to be a propellant for achieving, through the Ovation platform, the vision Yeager laid out 25 years ago.
It was only a few years ago that owner/operators of GE E- and F-class gas turbines learned technicians from Advanced Turbine Support LLC could extract or blend shims in the first three compressor stages in-situ—no case removal necessary. That was a big deal because shims found protruding into the compressor air stream during a borescope inspection could be dealt with immediately, preventing an offending shim from possibly going downstream and damaging rotating and stator blades.
Update: A week ago, Mike Hoogsteden, Advanced Turbine Support’s director of field services, called to say the company’s technicians had removed in-situ a protruding shim in the 12th stage of a 7EA, saving the owner the more than $400k it would have cost to extract the shim had case removal been required.
It was perfect timing for this industry-first accomplishment given the 7EA Users Group meeting convenes online about two weeks (October 20). Register now (users only) at no cost and come up to speed on developments and experiences in the 7B-EA fleet since the 2019 conference. The virtual venue under the Power Users umbrella is certain to push attendance to new heights and share information valuable in decision-making.

Hoogsteden added that the protruding shim was located above the right case break (photos) and that the peaking unit had recorded about 8500 service hours and nearly 700 starts when the inspection was conducted. He suggested that O&M personnel new to the GE E-class fleet become familiar with TIL-1562, “E- and F-Class Shim Migration and Loss,” issued in January 2007. To dig deeper into the subject, consult the 7EA Users Group library on the Power Users website and meeting reports available in CCJ’s searchable archives at www.ccj-online.com.
Advanced Turbine Support developed, patented, tested, and proved a few years ago the tooling that today allows—depending on rotor stacking—in-situ blending of compressor blades and stator vanes as far back as Stage 12 with favorable access.
The blends can be analyzed by engineering to determine any associated risks both before and after the work is done. Hoogsteden says his company recommends attempting in-situ blends on rotating blades and stationary vanes when engineering analysis confirms such repairs are preferable over immediate unit disassembly.
Concerning shim migration, he adds that once a shim has migrated to approximately 50% of its height and is protruding into the air stream, the OEM no longer considers this a low-to-medium risk condition and it should be removed or blended flush.
If the coronavirus pandemic has taught us one thing, having the ability to access the expert information needed to perform O&M tasks at the highest level without leaving the plant (or home) is vital. With good internet connections generally available at most powerplants, the challenge might be finding the information required. You likely have several preferred websites to search, ones that may have helped you in the past.
If CCJ not one of them consider adding it to your “preferred websites” list. Our online library, keyword searchable on the homepage, can direct you to perhaps unimagined resources on the operation and maintenance of gas turbines and combined cycles. Included among these resources is our webinar library.
At home you might access a service such as Netflix for leisure viewing; at work search CCJ’s webinar library for guidance on how to identify and implement critical O&M solutions capable of helping you and your colleagues improve plant safety, availability, and performance.
To learn more about the library and its value for your facility, please skim the content summaries below of webinars conducted in the last few months and use the links provided to watch one or two. No charge! Note that several more online conferences and webinars are scheduled before year-end—including the 2020 meetings of the 7EA, Steam Turbine, Generator, Combined Cycle, and Power Plant Control Users Groups.
CONCO
Every owner/operator of a plant with an air-cooled condenser (ACC) might benefit from listening to Gary Fischer on the value of an ongoing condition-assessment program and how the experts find performance-robbing leaks quickly. His presentation is fast-moving, easy for both new and experienced employees to understand, and answers the question, “Why do we not want to try doing this with plant personnel?”
Fischer begins with several slides on the importance of cleanliness, the sources of fouling, and how to remove external deposits (Fig 1). The free flow of air across all heat-transfer surfaces is critical, the chairman of the ASME Heat Transfer Committee reminds. A 20% reduction in air flow because of fouling and debris nestled in an ACC’s finned tubes will increase turbine backpressure by 33%, decreasing electrical output and reducing revenue.
Pushing fans to their maximum to reduce the impact of fouling is not a solution. It only exacerbates the negative impact on financials because auxiliary load increases and you wind up consuming more power at a time when you’re making less money.
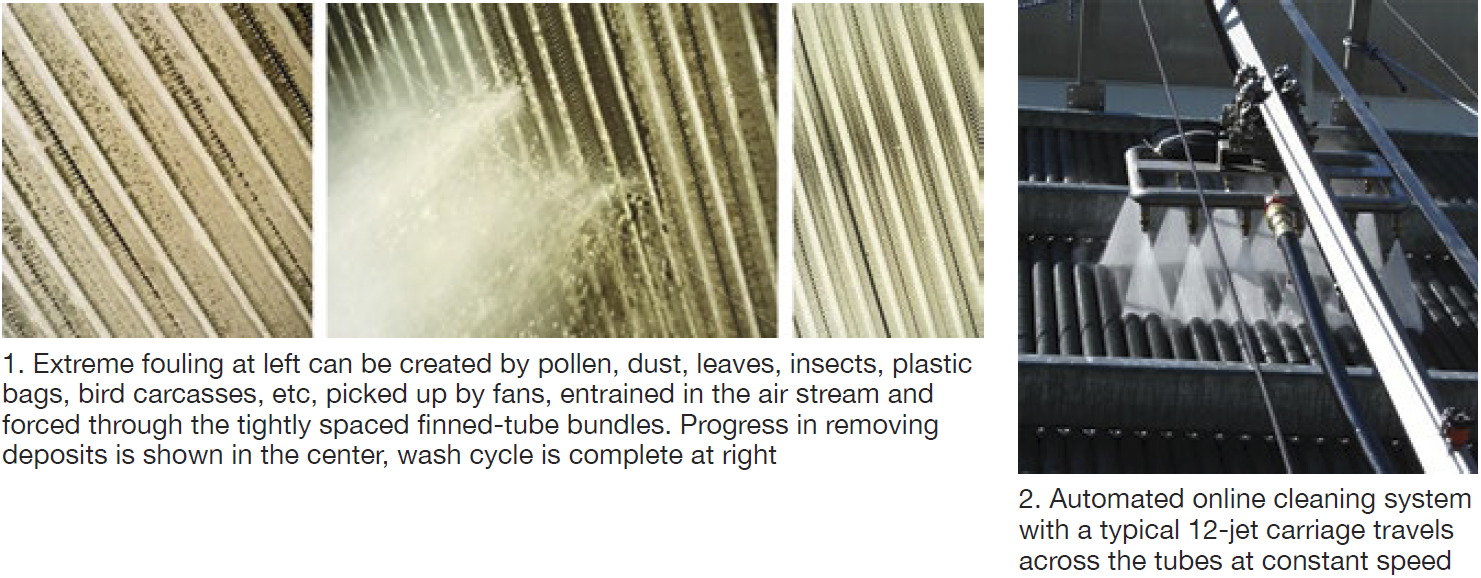 Fischer dismisses the use of fire hoses (too much water, minimal cleaning effect) and high-pressure hand lances (damage to fins and galvanized surfaces) in short order and touts the value of automated cleaning (tight process control, uniform cleaning, no need for scaffolding).
Automated online cleaning systems, such as that shown in Fig 2, have the advantage of delivering a high volume of water at a pressure that will not damage fin and tube surfaces; plus no scaffolding is required. A focused array of water jets mounted on a trolley distributes water deep into the bundle with the opportunity to adjust the jets to optimize the washing effect. The typical carriage holds a nominal one-dozen jets and travels at constant speed across the tubes, assuring effective cleaning in one or two passes.
Testing for and minimizing air in-leakage was the focus of the second part of Fischer’s presentation. For identifying the source of air in-leakage, he says non-hazardous helium wins hands-down. Detection is quick and reliable for most leaks at 1 part in 10 million above background (5 ppm). Perspective: Sometimes you’re looking for a leak less than the size of a dime in a surface area equivalent to three or four football fields. Helium can help you find that.
Oftentimes leaks are not where an inexperienced person might believe they are. A leak can be outside the ACC proper and in the hogger or hogger exhaust, the gland-seal drain/trap, the crossover bellows, or at welds in retrofit projects, etc. Don’t be surprised to find an air leak in a new unit, Fischer adds. Indicators of in-leakage are high backpressure, dissolved oxygen, and continuous hogger use.
Concludes Fischer, tracer-gas leak detection is a very cost-effective method for maintaining Rankine cycle efficiency where ACCs are installed.
CECO Environmental
The presentation by Vaughan Watson and Jeff Broderick is suggested viewing by users looking to come up to date on SCR technology and peer into the future of emissions control. The presenters speak to the following technologies and applications from CECO that they consider “next generation”:
-
- Rapid Advantage SCR (RASCR™).
- Urea as an SCR reagent.
- Direct injection.
- EDGE® ammonia injection grid (AIG).
RASCR, Watson and Broderick say, can be adapted easily to an existing plant to maximize SCR performance. It uses fuel as the heat source for reagent vaporization, rather than an electric heater, thereby promoting rapid compliance with permitted NOx emissions during unit starts and transients. Emissions compliance reportedly is achieved within 30 minutes of a gas-turbine start, typically in less than 15 minutes. Natural gas or oil can be used as the heat source for all reagent solutions, including urea.
Retrofits can be installed during a short outage. RASCR integrates with the existing ammonia vapor discharge line and the fuel supply system. Today’s low natural-gas prices typically offer an ROI in six months or less based on the reduction in parasitic power consumption.
Webinar attendees provided these facts related to NOx control at their facilities:
-
- Seventy percent of the participants said their plants have duct burners upstream of the SCR.
- The heat source for ammonia vaporization was electric 59% of the time, gas 28%.
- Fourteen of the plants polled were using RASCR technology, including five on HRSGs.
Reagent options for SCR systems are anhydrous ammonia, 99.95% pure NH3 stored as a liquid under pressure; aqueous ammonia, typically 19% to 29% NH3 by weight and stored as a liquid under pressure; and aqueous urea, a mixture of urea powder and water in solutions containing 32% to 50% urea with storage in an atmospheric tank. Recall that safety risks are associated with ammonia, not urea.
Urea may be making a comeback as a safe alternative to ammonia, the speakers say. If you’re not familiar with the reagent, be aware that it is corrosive and must be stored in tanks made of stainless steel or FRP (double-wall recommended). Piping and pump materials of construction, and seals, also must be compatible with the fluid.
Plants using anhydrous or aqueous ammonia as the reagent for their SCRs can be made more safe by converting to urea. In the case of anhydrous ammonia, the conversion to aqueous ammonia or urea requires addition of a fluid handling skid and vaporizer system. A new storage tank also may be required depending on its condition, capacity, etc. Going from aqueous ammonia to urea will require a stainless steel or FRP tank and possibly changes to the fluid handling system regarding materials compatibility. Plus, vaporizer capacity probably will have to be increased as urea decomposition requires more energy than ammonia vaporization.
Direct injection is a method for supplying ammonia vapor to the SCR system gas path without need for a vaporization system or AIG. Its advantages include lower capital and operating costs, primarily because there’s less equipment. Photos, case history, and data tables presented by the speakers make listening to the presentation beneficial.
EDGE. Participants learned that CECO’s new AIG lance with a square (instead of circular) profile is designed and optimized to provide the desired reagent distribution across the duct to assure expected SCR efficiency and performance. The square cross section promotes better mixing, thereby improving NOx reduction, reducing ammonia slip, promoting longer catalyst life, and reducing the cost of operation. The likelihood of AIG fouling and plugging also is reduced because EDGE provides a place for deposits to accumulate without plugging the nozzles.
Explanatory drawings, lab flow-test results illustrating the degree of mixing achieved, and a case history provided in the presentation attest to the product’s success in the field.
EthosEnergy
You can run longer: What to do when your GE gas turbine is reaching the designed rotor end-of-life limit, Kale Dreymala, gas-turbine rotor project manager, EthosEnergy Group.
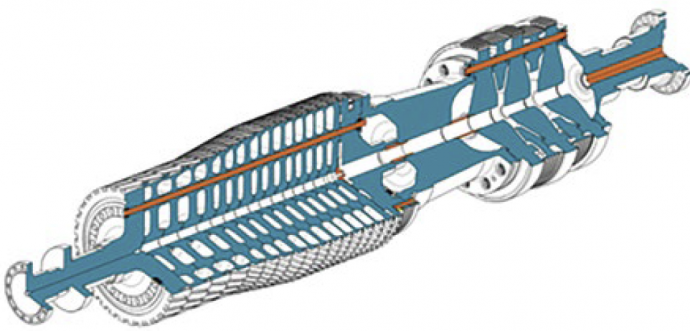 If your plant is equipped with a GE industrial gas turbine—Frame 3, 5, 6, 7 (A, B, C, E, EA, and/or F)—and mention of the OEM’s Technical Information Letter 1576, “Gas Turbine Rotor Inspections,” does not strike a responsive chord, obtain a copy today from your plant’s GE representative.
TIL-1576, released in 2007 and updated in 2011 (1576-R1), identifies the equipment and personnel risks associated with operating gas-turbine rotors beyond 200,000 factored fired (FF) hours (144,000 for F-class units) or 5000 FF starts, whichever comes first, when specific intervals are not defined.
This TIL refers you to GER-3620 for overall guidance on centerline maintenance that the OEM recommends. The latest version of 3620 is Rev N, issued in November 2017. You can obtain a copy with a simple Google search. Rev N is important because it considers the impact of forced cooling on rotor inspection calculations (pages 30 to 35 and Fig 45), replacing the “trip from load factor” in earlier versions of the document.
Kale Dreymala walked webinar participants through the inspection scope recommended by EthosEnergy Group (EEG) for turbine wheels, distance piece/spacers/stub shaft, and compressor wheels. Here’s the lineup of inspections typically recommended:
Compressor and turbine wheels
-
- Visual inspection of all surfaces.
- Semi-automated phased-array ultrasonic (UT) inspection of the bore, web, and rim areas.
- Semi-automated eddy current (ET) inspection of the through-bolt holes.
- 100% ET inspection of the dovetail serrations in the compressor wheels and the fir-tree serrations in the turbine wheels.
Distance piece, spacers, stub shaft
-
- Visual inspection of all surfaces.
- Semi-automated ET inspection of the through-bolt holes.
- Semi-automated phased-array UT of the bore.
Other inspections
-
- Hardness.
- Replication.
- Dimensional measurements.
If these inspections produce no findings, the rotor is reassembled with new bolts and your engine receives a certification for an additional 50,000 FFH (one time only).
If there are findings, the speaker says the OEM is likely to suggest buying a new rotor or possibly a replacement wheel or disc, if that is the life-limiting part.
By contrast, an affordable aftermarket solution suggested by EEG probably would be to obtain a used rotor with a documented history and refurbish it in the shop. The additional life certified (from 50,000 to 200,000 FFH) depends on an engineering review. Note that for peaking units, no extensions are allowed beyond the 5000-starts limit.
Dreymala went on to describe EEG’s capability for manufacture and qualification of new rotor components as might be required during the refurbishment process get the best balance between cost and additional life. Other rotor options also were presented during the webinar, which was not recorded for post-presentation viewing. However, you can write the speaker with questions and/or for a copy of his presentation at kale.dreymala@ethosenergygroup.com.
Nitto
Depending on the type of generator cooling at your plant, and the gas-turbine fuel, a fool-proof hydrogen leak-detection program can be critical to protecting employees, the environment, critical equipment, and the overall business. This presentation presents details, data, and results of field trials of a pipe flange tape, developed for NASA, that changes color in the presence of hydrogen (photos). Thus, it provides a visual indication of a leak because it will not return to its original color once hydrogen gas flow stops.
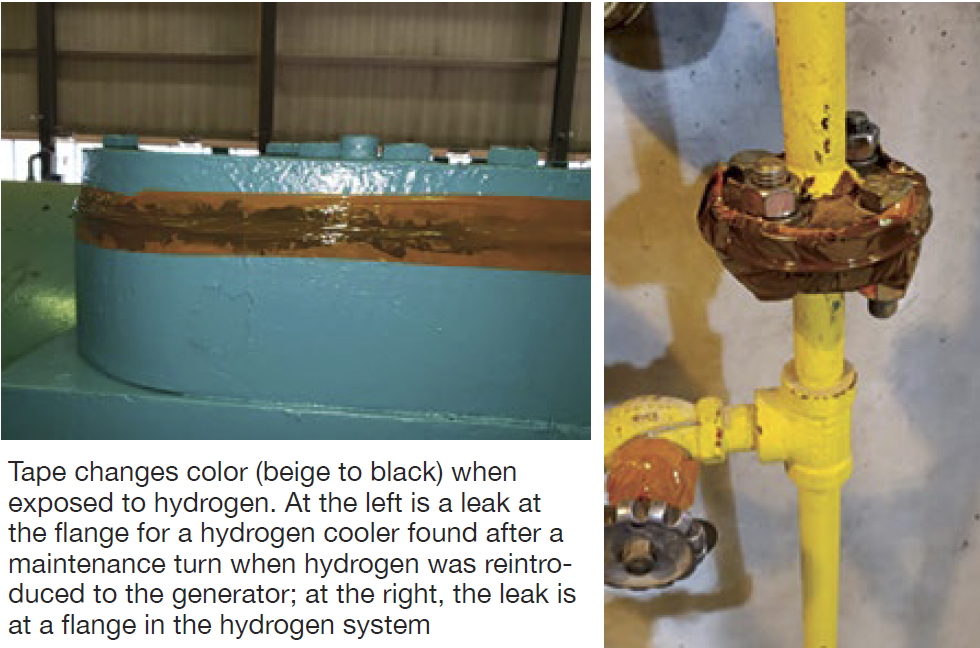
The presentation shows that soap tests typically used to find hydrogen leaks may not deliver consistent results and provide the confidence that connections/joints are not leaking. In field trials at one utility, 38 flanges were taped. All had been soap-checked prior to using the tape. Once installed, the tape on four flanges changed color within two days. The tape was removed from the flanges and the joints were soap-checked again. Only one of the leaks was large enough to cause bubbling visible to the eye.
Plant personnel concluded that the hydrogen-detection tape worked well as a pre-emptive safety check and has stimulated proactive thinking about previously unrecognized problems. Use of the tape is now part of the plant’s hydrogen-system restoration procedure following generator maintenance.
TRS Services
If you’re involved in gas-turbine repair planning, the editors suggest you listen to the presentation by Greg McAuley and Pete Sobieski, both highly experienced in the planning and conduct of turbine repairs. Each spent a decade or more with a gas-turbine OEM and two or more decades with a major owner/operator before getting back together again at TRS and expanding the company’s mission.
Today, TRS offers turbine component repairs, new-parts manufacture, and consulting services aimed at reducing downtime, minimizing total costs, and enabling new opportunities. The outcomes expected from the company’s work: reduced downtime, fewer unexpected errors, lower costs, and less hassle.
The presenters define repair planning as the process of defining the tasks important to know with a high degree of certainty what components should be retired or repaired, and to achieve the lowest lifecycle cost for parts that should and must be repaired.
McAuley and Sobieski say the five essential ingredients to successful repair planning are the following:
-
- Focus on lifecycle costs.
- Know parts pedigrees.
- Have a fallout plan.
- Choose the right partners.
- Start execution early.
They discussed each of these in turn. For lifecycle cost analysis, the speakers provide calculational examples for repairs to transition pieces and R1 ring segments, with service hours a primary variable. The results might startle you; certainly, they illustrate why this is a very important step in project cost control.
Know your parts illustrates the level of expertise necessary for an accurate evaluation of in-service components. Prior to making a repair decision the speakers say you should know lifecycle costs, hours/starts since last repair, visual appearance, repair history, the OEM’s part expectations, industry experience with a similar part. Of course, your personal experience with the repair of a similar part also is important to the evaluation.
A helpful takeaway tool is the partner evaluation process which offers a price/value comparison across the partner options entered into the equation. A discussion on contingency planning and an action plan to mitigate fallout risk.
EthosEnergy
Improve availability and reduce costs? Your data knows how. . ., Brady Kirkwood, technical services manager for EthosEnergy Group’s monitoring and diagnostics department.
Brady Kirkwood covered short-term (performance analytics) and long-term (advanced predictive AI) methods of how to identify degraded systems and provide quantifiable potential performance gains. Having the tools to evaluate the cost versus benefit of individual system upgrades/repairs to plant systems is critical to improving performance with today’s limited maintenance budgets.
The speaker provides profiles of real events resolved by EEG, including these:
-
- Hidden problem with inlet fogging causing a reduction in plant output.
- An OEM “repaired” bearing oil leak causing compressor fouling.
- Slow degradation in turbine performance during a period of high demand.
- Forced outages caused by lean blowouts.
- Fouling of inlet filters caused by the increased particulate loading attributed to forest fires.
Two goals of the presentation are to identify hidden issues and predict future issues, thereby reducing reactive activities that result in unbudgeted costs. Kirkwood walks you through a plan for reducing reactive maintenance, how to conduct a thermal performance audit to identify underperforming systems, short-term versus long-term solutions, and the financial impacts of unplanned outages and lost generation.
Unfortunately, this presentation was not recorded for post-presentation viewing. However, you can write the speaker for a copy of his informative presentation at brady.kirkwood@ethosenergygroup.com.
EthosEnergy
Decrease cost and simplify outage planning with zero-leak-time components, John Jensen, VP new-product commercialization, EthosEnergy Group.
John Jensen covers the range of flexible EEG solutions geared towards improving the accuracy of your gas-turbine outage plan and reducing the risk inherent in traditional component repair services. Presentation takeaways include the following:
-
- Understand the obstacles to improving outage planning.
- How to remove component repairs from outage planning.
- EEG’s commitment to supporting customers with outage planning and emergency situations.
Jensen says EEG has the depth to effectively and efficiently manage risks in repairs, parts manufacturing, rotor life extension, multi-year maintenance contracts, and plant operations and maintenance. Its capital-parts exchange capabilities eliminate lead-time risk and scope creep of traditional repairs. Repair fallout risk is mitigated by accommodating it outside the plant’s schedule.
This presentation was not recorded for post-presentation viewing. Owner/operators can request a copy of the PowerPoint from john.jensen@ethosenergygroup.com.

