Originally, generators were cooled by once-through open air flow. Contamination problems led to closed ventilation systems, with water-to-air heat exchangers to remove the thermal losses—the TEWAC cooling system (Totally Enclosed Water-to-Air Cooling). This type of system is still very popular for small generators.
But by the 1930s, ratings were reaching a size where the ability of cooling with air was limiting further increase in rating. Engineers recognized that use of hydrogen gas as the atmosphere had important advantages: low density, high specific heat, and the high thermal conductivity. In particular, windage losses were reduced to about one-fourteenth that of air. Also recognized: hydrogen gas is highly explosive, unless hydrogen purity (freedom from oxygen) was kept out of the range between about 4% to 94% oxygen, by volume.
A high-level development program produced the necessary hydrogen shaft seals and system controls to permit the first hydrogen-cooled generator to enter service in the USA in 1937. By coincidence, this was the year of the Hindenburg hydrogen-filled airship disaster. But there was no OSHA at that time, and hydrogen cooling came into common usage for large generators.
 Over the years there have been a few hydrogen accidents involving serious plant damage, and personnel injury and death. The nature of a hydrogen fire is such that damage can be dramatic—that is, hydrogen tends to detonate and produce a high-pressure wave that can blow the siding off an entire building and bend a steel door.
Size limitation came again at around 200 MW in the mid-1950s and manufacturers began development of “direct-cooling” methods—that is, the cooling media in direct contact with the copper electrical conductors of the stator and rotor.
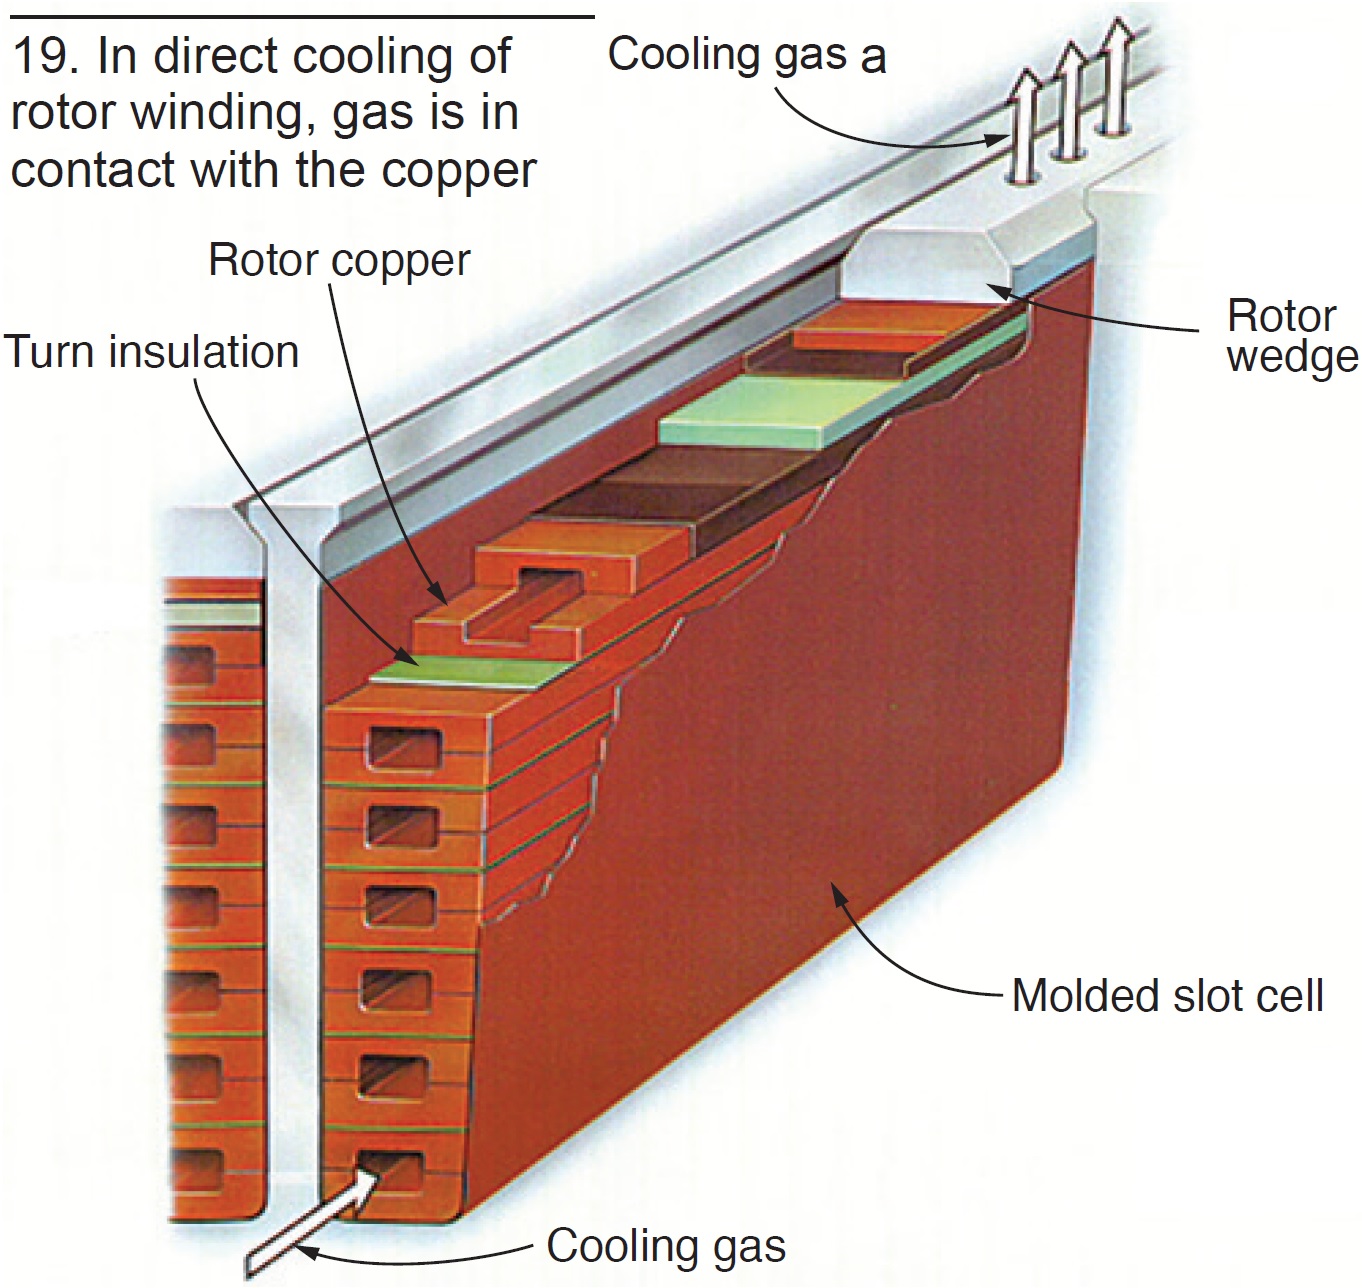
In rotor-winding indirect cooling, gas flows in passages within the forging, thus cooling the forging. The cooled forging then cools the copper by conduction. With direct cooling, the gas is in direct contact with the copper (Fig 19).
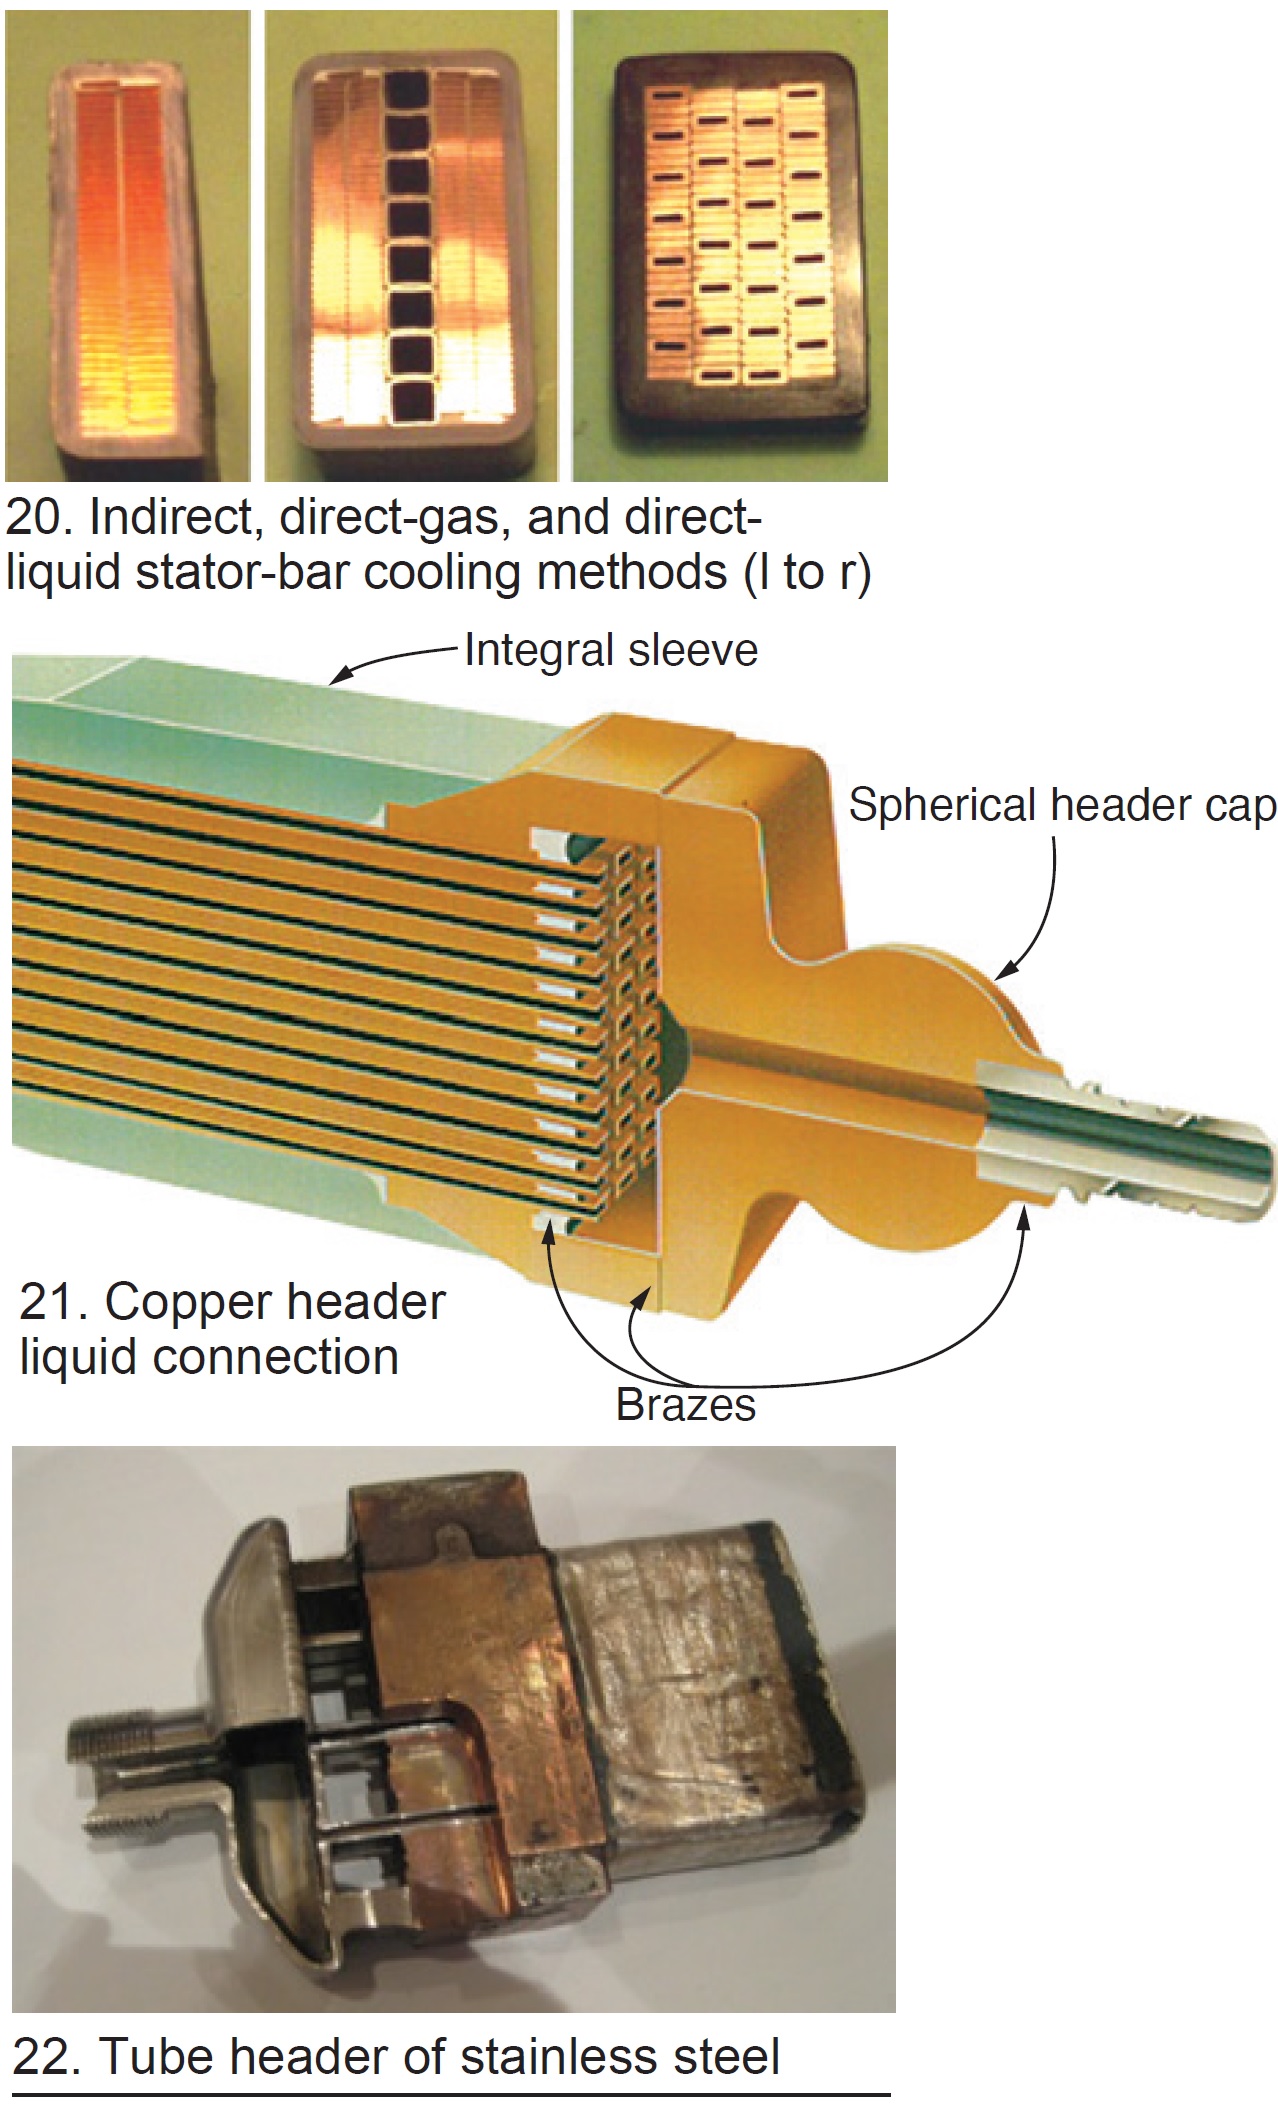 Stator windings until about 1960 were cooled indirectly (Fig 20 left). Two types of direct cooling were developed during the late 1950s and are in present usage, center and right bars in Fig 20.
With indirect cooling, all thermal losses must traverse the thickness of the ground insulation. Given that electrical insulation is an excellent thermal barrier, there was incentive to pursue direct cooling methods.
With direct gas cooling, only the strand and tube insulation must be traversed. These barriers are thin and offer little thermal resistance. The bar mechanical structure becomes rather complex in this type of cooling, but a very large number of direct-gas-cooled generators are in service and the design has generally has performed well.
With the common method of direct liquid cooling, the coolant is in direct contact with the heat-generating copper. Usually, a mix of hollow and solid strands is used with all strands brazed as a unit into a copper alloy strand header (Fig 21).
Less common is the use of stainless-steel tubes individually welded into a stainless header separate from the copper strand connection (Fig 22).
The direct-liquid-cooled designs have had OEM-specific service problems, but in general have performed well.
Generators Table of Contents
Intro: Generators, a brief history
Part 1: Electrical insulation systems
Part 2: Winding support systems
Part 3: Generator cooling methods
The mechanical duties on rotor forgings are extremely demanding on the high-speed generators typically coupled to gas and steam turbines, and great effort has gone into development and optimum application of these forgings. Thus, a few words on this topic are in order here.
Rotor body forging
The main rotor body forgings reached a crisis point in the mid-1950s. During a factory high-speed balance, a body forging failed catastrophically in the OEM’s balance facility. Fortunately, the failure occurred during night shift and few workers were in the plant. But the two young test engineers operating the facility were both killed.
A few months later a field body forging failed in an operating power plant. Damage was considerable, but there were no casualties.
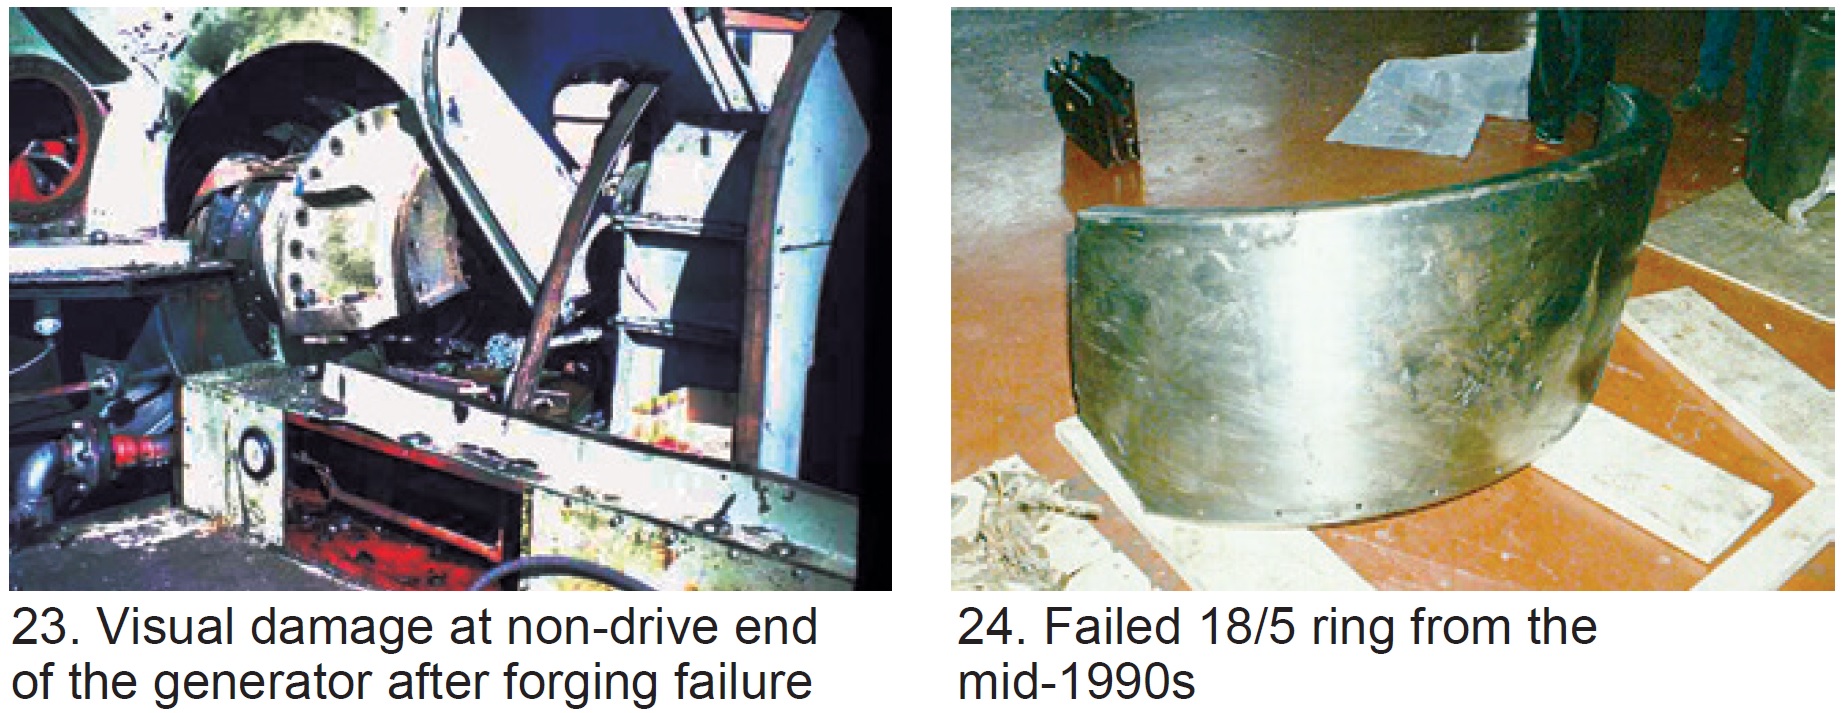
In 1956, a third rotor failed in an operating powerplant. (The writer would have been onsite at the time of failure had he been home to answer the phone.) This failure severely injured three or four persons and destroyed the turbine/generator (Fig 23).
The resulting investigations found that there were huge inclusions in the basic forgings—perhaps larger than 10 in. in diameter. These inclusions were inherent in the casting processes due to heavy contamination in the liquid metal. As the ingot cooled, the impurities percolated toward the ingot center and top.
Further contributing to forging vulnerability was that the materials had a Fracture Appearance Transition Temperature (FATT) of about 40C. This was totally unacceptable because it means that the material had poor ductility (behaved as a brittle material) below 40C, and was intolerant to fatigue stress cycles associated with start/stop duty.
Within a very short time the steel mills were able to produce forgings of much better quality and no further large-field forging failures occurred.
Retaining-ring forgings
Retaining-ring materials also went through a complex evolution. Originally rings were magnetic steel, but as size of generators increased a point was reached where rings of non-magnetic material would be highly beneficial. (This need is based on complicated electromagnetic design challenges related to excess end-of-core heating as load moved toward the leading-power-factor region.)
The most common of the non-magnetic rings was the 18/5 (18% manganese/5% chrome) material. It was found susceptible to stress corrosion cracking—that is, under high tensile load and in the presence of water, intergranular cracking occurred. This condition led to several ring failures (Fig 24). Needless to say, that stator winding damage was thorough.
Stress-corrosion damage progresses quickly. The ring in Fig 24 had been removed and given a full nondestructive test 18 months earlier and found trouble-free.
The problem with 18/5 material was recognized in the 1970s. Around about 1975, an OEM/steel-mill joint development program was initiated. From that effort the 18/18 (18% manganese-18% chrome) alloy was developed. The material, characterized by high and stable tensile strength, is highly specialized and can be produced only in relatively few facilities worldwide.
The 18/18 alloy is not nearly as vulnerable to the stress-corrosion phenomenon as the 18/5 alloy, and has been reliable in service since its introduction. It is now the industry standard material for this application.
Generators Table of Contents
Intro: Generators, a brief history
Part 1: Electrical insulation systems
Part 2: Winding support systems
Part 3: Generator cooling methods
Clearly, this article, presented in the four sections bulleted below, provides a very general overview of generator history, with more left unsaid than said. No doubt there are errors of omission as well as commission. But hopefully the reader has gained a better appreciation for the efforts that went into the generator designs of today.
- Intro: Generators, a brief history
- Part 1: Electrical insulation systems
- Part 2: Winding support systems
- Part 3: Generator cooling methods
- Part 4: Generator rotor forgings
- Wrap-up: Generators, a brief history
The evolution of the large generator has presented many difficult challenges to the engineers who design them and to manufacturing personnel who make them. Progress will continue, but with continuing increasing sizes and continuing cost pressures, old problems will recur, present problems will continue, and new problems inevitably will develop.
Keep current on new generator developments of importance by attending meetings of the Generator Users Group, conducted under the umbrella of Power Users, and by participating actively in the online forum hosted by the International Generator Technical Community. The IGTC is a global self-help group with over 5000 members sharing generator challenges and solutions.
Powerplants built over the past several decades are packed with instrumentation, transmitters, and computers. This extensive automation has allowed reduced staffing levels while introducing challenges for effectively analyzing and acting on degrading conditions that may occur long before alarm levels are reached.
Many combined cycles use all, or portions of, remote monitoring and diagnostic (M&D) support. Having had remote M&D experience at other plants, the Fairview staff wanted to share some tips gained while operating under the comprehensive M&D program established by owner Competitive Power Ventures.
CPV thought it important to contract M&D as a service offering, as opposed to purchasing software to use in-house. Knowing that plant teams are running lean, with each team member already playing a strategic role, the manpower required to learn and maintain new, complicated software wasn’t readily available. The M&D services contracted both compliment and augment Fairview’s in-house capabilities.
The plant team recognizes the service offering is a dynamic and adaptive process that can be improved as lessons are learned. Communication with the service provider is a “two-way street.” Staff doesn’t hesitate to ask the provider for help diagnosing symptoms or adding specific logic that might not have been included in the original setup.
Outsourcing M&D as a service has several advantages, including the following:
- More cost effective than staffing a dedicated in-house team to manage M&D around the clock, 365 days a year.
- Remote M&D frees up the limited plant staff to remain focused on other demands of the job.
- When set up correctly, M&D can alert to adverse conditions that might otherwise go undetected. The example trend in Fig 1, flagged by remote M&D software, illustrates a 1-in. drop in lube-oil sump level over about a six-month span. During a subsequent review, plant personnel confirmed they had been collecting oil from a small leak while awaiting an outage to replace an oil deflector.

Staff welcomes the benefits offered by a remote M&D tool that ultimately supports the team in generating power safely and reliably. Using the major equipment OEM to provide M&D services has the additional advantage of leveraging specific fleet lessons into the software that monitors for known adverse patterns. Plus, it allows for the consolidation of all issues into one platform where they are tracked and discussed on a regular basis. Recommendations that come from the OEM through the platform have the advantage of access to the OEM’s bench strength.
In another example of how subtle deviations are picked up by the remote service, the trend plotted in Fig 2 shows process flow versus valve position. The software has identified a subtle variance in which no flow is observed with the valve slightly open. Cases like these are flagged and discussed with the plant team in regularly scheduled meetings.
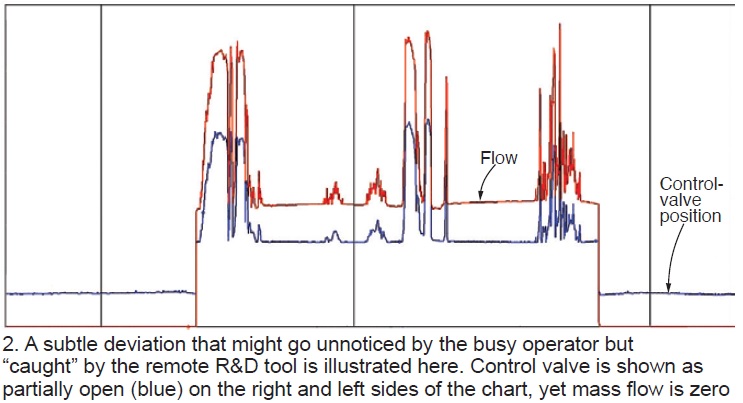
While some deviations may be minor issues, if the valve in question is inlet bleed heat, for example, it may be robbing output or not protecting against compressor icing if left unchecked. Symptoms like this can be difficult for humans to catch, particularly when they are tasked with overseeing several thousand data points across multiple DCS screens.
For owners like CPV with multiple assets, remote M&D greatly enhances the ability to stay current on plant issues across their fleets. Plant personnel manage the program, participate in biweekly calls discussing recent anomalies, and provide updates on previous actions taken.
M&D also serves as a tool to aid to help drive the scope of work for upcoming outages. Program effectiveness can partially be quantified by observing the number of actions items landing on outage planning lists.
Even though the M&D service is performed by the turbine OEM, the entire BOP is monitored as well for Fairview Energy Center and other CPV plants—including turbine heat rates, machine-specific efficiencies, and full plant performance. This service adds significant value even though performance calculations already are being performed in-house. A comparison of independent thermal models serves as a QA function and helps to confirm causal factors of degradation.
If you currently have a “turbine-only” option for remote M&D monitoring, it’s worth reassessing the value of “whole plant” remote monitoring.
Early detection of adverse conditions has reduced forced-outage hours at Fairview, and in at least one instance, prevented additional consequential damage to a gas turbine. Discoveries are shared by email in advance of biweekly planning calls to review new issues and track disposition of previous actions. The conference call includes M&D engineers, plant staff, and owner management collectively determining (1) which repairs can be deferred to outages, (2) needed parts, and (3) whether the work can be performed safely without shutting down.
Urgent symptoms are phoned in to the control room from the remotely staffed monitoring center, and in high-priority cases, a notification is sent to the plant manager, who recalls times at other facilities in which he was notified with a recommendation to immediately shut down.
In one instance, rotating turbine blades were losing material because of contact with stationary vanes. In another, compressor blades were damaged. In both cases, alarms had not yet activated, the adverse conditions having been caught by M&D software and the 24/7 remote monitoring team. Though there certainly is value in avoiding an imminent failure, the aim is to identify and address issues well ahead of failure, allowing staff to avoid or reduce forced outages by converting them to planned outages. This is what drives Fairview’s ROI.
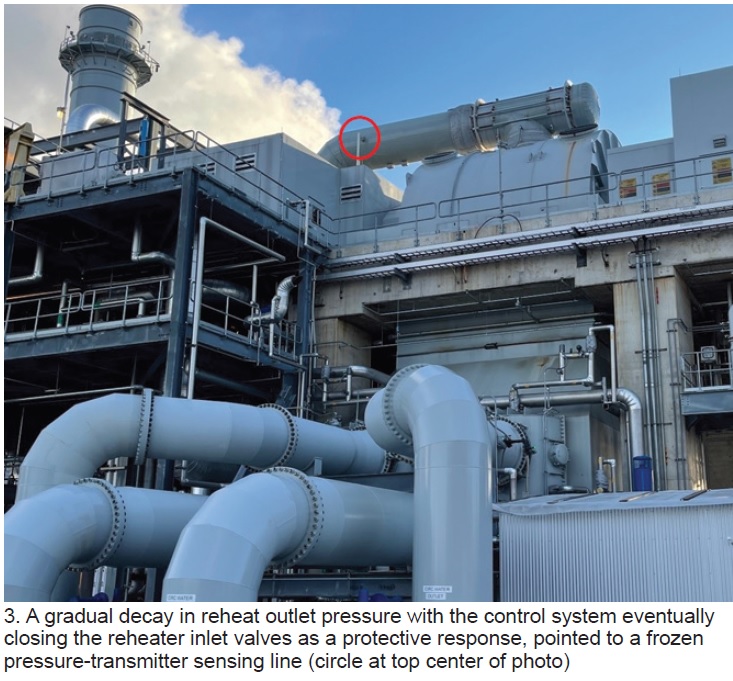
During a recent cold-weather-induced event, plant staff initially struggled with a thrust-related steam-turbine alarm that was void of evidence to confirm an actual thrust condition. The only symptom preceding the alarm was a gradual reduction in turbine reheat outlet pressure. M&D engineers explained the alarm was a calculation based on the difference between inlet and outlet pressures and an assumed thrust.
Subsequent investigation revealed a sensing line had slowly frozen, resulting in a gradual decay of reheat outlet pressure with the control system eventually closing the reheater inlet valves as a protective response. The decision to phone M&D early greatly reduced forced-outage time during a peak market period that could have otherwise resulted in steep financial penalties. The affected sensing line circled in red can been seen in Fig 3.
Relative to notifying M&D for urgent support, Fairview personnel recommend keeping the M&D phone number programmed in your cell phone along with each unit’s serial number. Staff can be overwhelmed with alarms. Remote M&D can confirm suspect causes and open emergency engineering cases for review. Having turbine serial numbers visible on your cell is very helpful—particularly when you’re at home and initiate a call for help in the middle of the night.
Other benefits of M&D include minimizing the time for identifying and managing thermal-performance degradation and better preparation for planned outages.
Project involved several participants, including: Dominic DiBari, Ali Bibonge, Joe Michienzi, and Preston Patterson from CPV, and from the NAES plant operations team, Irv Holes, operations manager; Curtis Speer, lead operator; Rick Marshall, maintenance manager; and Jeff Lellock, engineering.

Fairview incurred several plant trips following commissioning because of valves hanging up and/or key parameters being overlooked until it was too late for the Mark VIe control system to keep the unit in service. After a handful of failed starts, staff began to discuss how plant operation could be made more reliable and profitable.
Most of the discussions revolved around issues experienced with key systems, the critical steps that had to be monitored simultaneously across multiple DCS screens, and the time it took to navigate numerous DCS pages.
Specifically, issues were found with attemperating valves not operating properly—typically just after minimum-emissions-compliance load was achieved, when the HRSG and associated piping began warming up and required cooling. Another troublesome area was the unit bypass valves not operating as expected. Or closing unexpectedly to protect piping from overheating because of failed attemperators, and initiating a unit shutdown in the process.
Working with onsite OEM personnel, staff learned other plants incorporated several parameters, previously spread out over multiple DCS monitoring pages, into a few simple pages. The specific items monitored—such as troublesome attemperators and their associated block valves, unit isolation valves, and steam-header bypass valves—were shown on individual pages for ease of monitoring during plant starts. However, grouping these separate DCS pages together into a single monitoring page mitigated the delay experienced when browsing page to page.
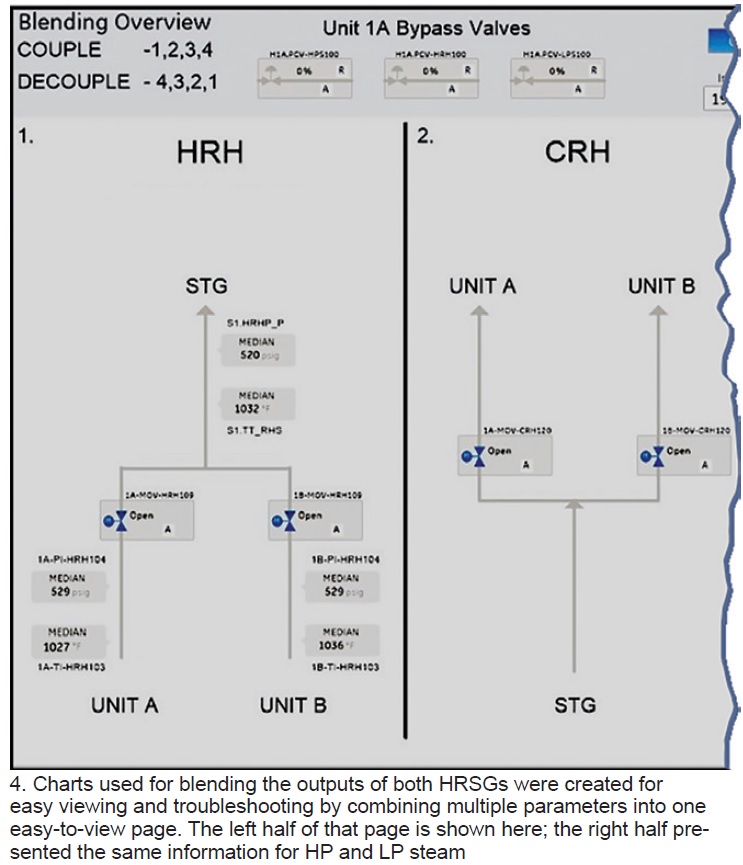
Individual pages used for blending the outputs of both HRSGs after an initial 1 × 1 startup were created for easy viewing and troubleshooting by combining multiple parameters into one easy-to-view screen (Fig 4). This single unit blending page consolidated what would have been eight separate pages into one.
Additionally, plant-specific, combined attemperator pages were created to monitor each unit’s attemperators during the crucial periods of startup to ensure that temperatures remain within design limits during GT starts and that valves move as expected (Fig 5). Attemperator and block-valve graphics from five separate DCS screens were condensed into one for each unit.
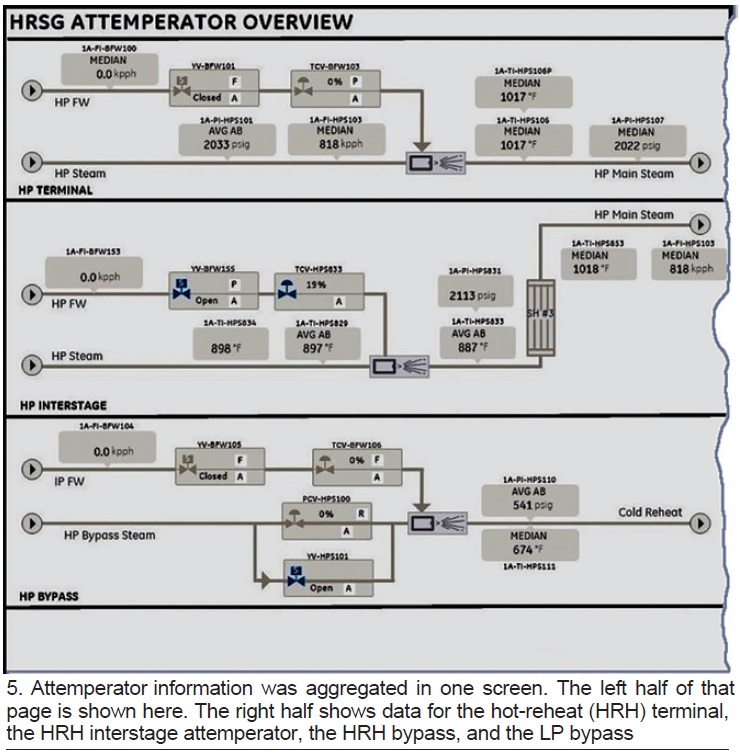
Monitoring the new DCS screens increased plant starting reliability, allowing Fairview to come online more consistently without delays, and dispatch sooner, say Burchfield and project participants Curtis Speer, control room operator; Aaron Roberts, I&E technician; and Dave Walker, FieldCore engineering team.

Soon after commissioning, staff discovered that a single point of failure of the ammonia-injection control valve could create an emissions exceedance, limiting the plant’s response and output, as dictated by state environmental permitting.
An hourly NOx exceedance was experienced less than one month after commissioning because of a faulty flowmeter indication. It limited the amount of ammonia injected necessary to meet the NOx removal rate at the desired load.
An alternative method for injecting ammonia was needed to maintain emissions compliance and remain online and dispatchable while operating with a fault ammonia control valve or associated instrument.
A redundant ammonia injection train was not desirable because of the time involved for procuring and installing the additional controls, combined with space challenges (Fig 6). An alternative means of ammonia injection was proposed by one of the plant’s operators—a manual bypass valve. It could be installed quickly and, if necessary, be replaced later by a fully automated redundant header with automatic control and block valve.
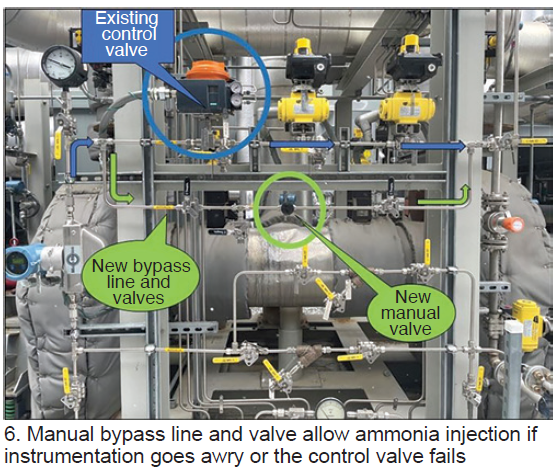
It was apparent that a manual bypass valve around the automated control valve would be essential for providing an alternative means of ammonia injection to prevent a NOx exceedance in cases of faulty instrumentation or failed control valve. By ensuring continuous operation with emissions limits, the plant would be able to stay online and ensure the reliability of the Bulk Electric System.
A management-of-change plan was initiated and a new ammonia line was specced out along with the valves necessary to both allow continued ammonia injection and permit safe changeout of the existing ammonia control valve in case it fails.
Success! A manual bypass control valve was installed and preset to a flow volume correlating to the ammonia injection rate necessary at baseload. The new valve reduces the probability of an exceedance by allowing expedited restoration of ammonia flow in the case of a valve or instrument fault.
As an added safety precaution for staff operating the bypass valve, a shield was installed to minimize the possibility of an operator being sprayed with ammonia accidentally in the unlikely event of a valve leak.
Site training was held on the newly installed valve and the operations required for its use, if necessary. In addition to installing the manual bypass, logic changes were implemented to make the existing automatic valves less susceptible to closing because of failed instruments. To date, the plant has not had to run with the manual bypass valve open. Presently, there is no need to replicate the automatic control and block-valve arrangement.
Employees contributing to project success included CROs Tim Krumenacker and Curtis Speer; Jason Havash, I&E technician; Jeff Lellock, engineering; and Brian Kline, O&M technician.
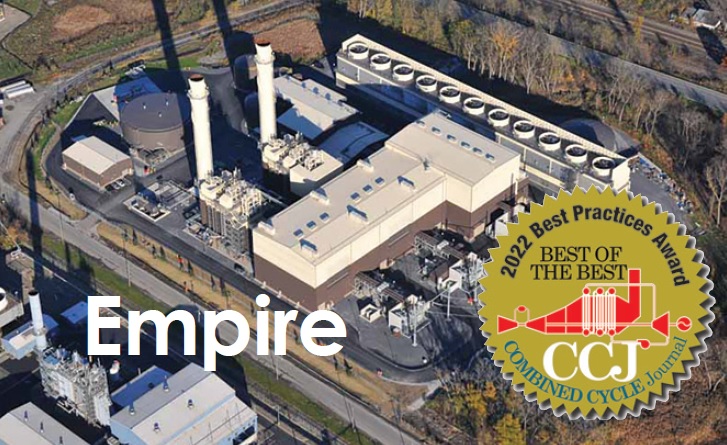
Falls are among the most common causes of serious work-related injuries and deaths. OSHA general industry standards require fall protection for persons working at heights of 4 ft or greater above a lower level (6 ft for construction). In 2021, falls remained the top OSHA citation for the 11th consecutive year.
Fall protection systems include employee equipment for fall arrest, such as harnesses and lanyards; special job-related equipment, such as travel restraints, D-bolts to attach to, anchor straps, etc; and fixed systems, such as ladders, guardrails, and gates.
At Empire Generating, individually assigned fall-arrest equipment was reaching its end of life. Plus, fixed fall-protection systems were from original construction in 2009 and some were deteriorating, difficult to use, or outdated. A thorough review was needed to identify (1) equipment which required replacement, (2) potential issues or deficiencies, and (3) better solutions to ensure employee safety and regulatory compliance.
A multi-year project began with a review to identify work tasks at heights, fall hazards, and the current systems in place. This was done by a third party, Safety Compliance Services, which produced a Fall Hazard Survey report.
It assessed all existing fall-protection equipment and systems, and fixed ladders, identifying deficiencies and equipment which should be replaced or removed, while making recommendations for upgrades. Each location or task requiring fall protection was ranked for exposure risk to assist in prioritizing projects. In addition, a plan for each location was made with recommended fall-hazard mitigation.
For individually assigned fall-arrest systems and associated equipment, a review was done based on fall hazards identified in the Fall Hazard Survey. Updated equipment was recommended—such as replacing the existing conventional lanyards with self-retracting ones (SRL), travel-restraint equipment, and the addition of other equipment. New harnesses and SRLs then were purchased and assigned to individuals.
Other equipment was set up in the turbine hall in a labeled cabinet for use as needed. All employees were fitted to their new assigned equipment and training was given by Safety Compliance Services on all of the new equipment.
Some of the items identified in the Fall Hazard Survey were done in-house—such as eliminating storage areas over several areas that would require fall-protection systems, installing several swing gates at the lube-oil and chemical bulk storage unloading area, and installing removable guardrails (photos).
L G White Safety Corp was brought in to review the plant’s fixed ladders and the other fall-protection system recommendations in the Fall Hazard Survey. A detailed proposal with photographs and recommendations was developed for ladder safety systems, rooftop equipment access, areas where rails had to be removed to bring up equipment or parts leaving edges unguarded, and where work was being done more than 15 ft from an edge.

In 2021, fall-protection systems were installed by L G White included these:
- Replacing six existing ladders on tanks and the stack ladders with 3M’s DBI-SALA® Lad-Saf™ systems that have a center tie off for fall protection and tie off points at the top and swing gates.
- Removing existing deteriorated horizontal lifelines and installing grated paths, guardrails, and self-closing swing gates for access to the roofs of the administration and water-treatment buildings.
- Installing a removable guardrail system for a turbine roof deck.
- Installing roof guardrails, swing gate, and a fixed ladder for an inside storage area over an office area (after ensuring load ratings were appropriate).
- Installation of a mezzanine safety gate in the turbine hall.
- A guardrail system to access rooftop vents that are more than 15 ft from a roof edge in several locations.
- Installation of a fixed ladder, swing gate, and working platform with rails to ensure safe access to valves on the top of carbon dioxide tanks.
Additional updates to the initial fall survey plans and procedures and training on the new systems are planned for 2022 now that those systems are in place. Annual inspections also were updated.
Plant participants in the project included Chet Szymanski, plant manager; Janis Fallon, EHS manager; Jason Glassbrenner, safety committee chair; and maintenance technicians Eric Palmer and Jim Smith. Third-party notables include Don Bessette of Safety Compliance Services and Mat White of L G White Safety Corp.
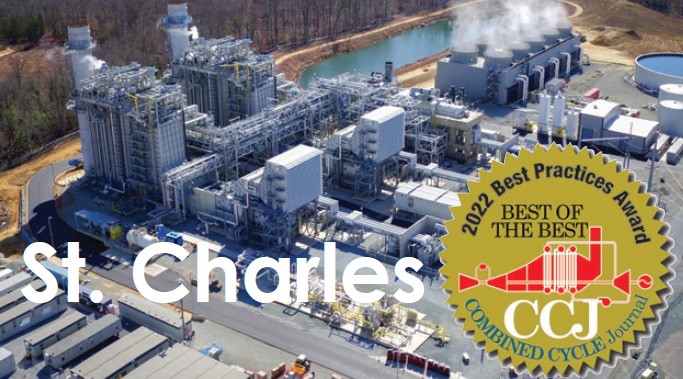
St. Charles Energy Center (SCEC) was commissioned in February 2017. Near the end of 2019, the plant experienced a through-wall leak at a girth weld on a hot-reheat (HRH) bypass line to the condenser, resulting in forced-outage time and the loss of generation revenue. But most concerning was that this was a significant safety concern which could result in a catastrophic failure.
Plant management reached out to Structural Integrity Associates Inc to aid in the analysis of the weld failure. A ring section containing the failed girth weld was removed and submitted to SI’s materials lab for review. Thermal fatigue was determined to be the most likely cause of the failure.
Staff worked with Structural Integrity to install local thermocouples (t/cs) around the failed area of the HRH bypass to assess the magnitude of thermal transients experienced during load-change events and normal operation. In sum, four t/cs were installed on the top, bottom, and sides of the pipe along with a local data logger. Over 30 days that the data logger was in place, temperature variations of up to 700 deg F were observed around the pipe circumference during load-change events.
The live data collected by the t/cs and data logger were analyzed by SI and sent to the manufacturer of the bypass valve. The supplier used these data to redesign the HRH bypass-attemperator spray-nozzle assembly while plant staff modified the attemperator’s logic to reduce the large temperature swings and the piping thermal stress they created.
Failure of the HRH piping weld worried staff because the facility had been operating for only two years. Staff was concerned there may be other unknown high-energy-piping (HEP) issues in the plant that could lead to a failure prior to a regularly scheduled inspection.
These concerns were expressed to Structural Integrity, which proposed a wireless sensor network and t/cs to remotely read data in near-real-time and incorporate the t/c readings into St. Charles’ PlantTrack online database.
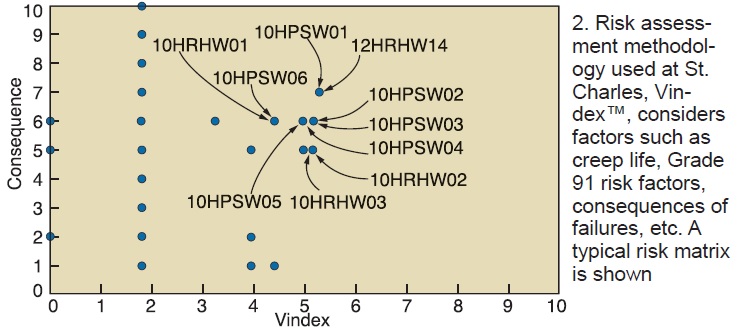
SI’s first step in making a timely transition from the facility’s traditional HEP asset-management roadmap to “smart data” monitoring was a risk assessment. The methodology used is known as Vindex™ (for vulnerability index). It considers factors such as creep life, Grade 91 risk factors, failure consequences, etc (Fig 1).
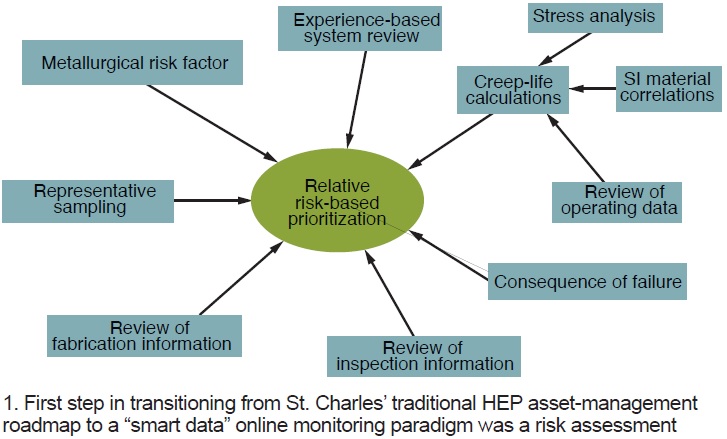
This approach incorporates inspection history and key component characteristics using structured and consistent methodologies that can be used across several piping systems. Each weld, or location of interest, was assessed according to component damage potential and consequence of failure.
The Vindex provided risk scores for each weld and for each pertinent system within SCEC’s PlantTrack database. Risk scores determined the HEP locations that would benefit from active online monitoring. The engineering study concluded t/cs should be installed at 10 locations (Fig 2) and active online pipe-hanger position monitors at nine. The latter provide real-time hanger-position data to the PlantTrack system to better understand and predict high-stress locations within the piping system.
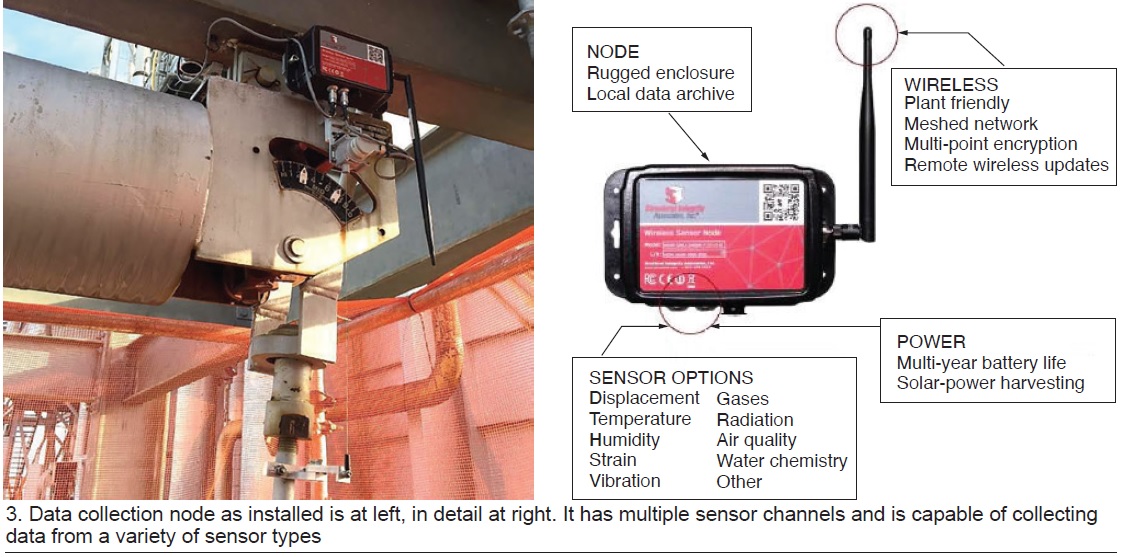
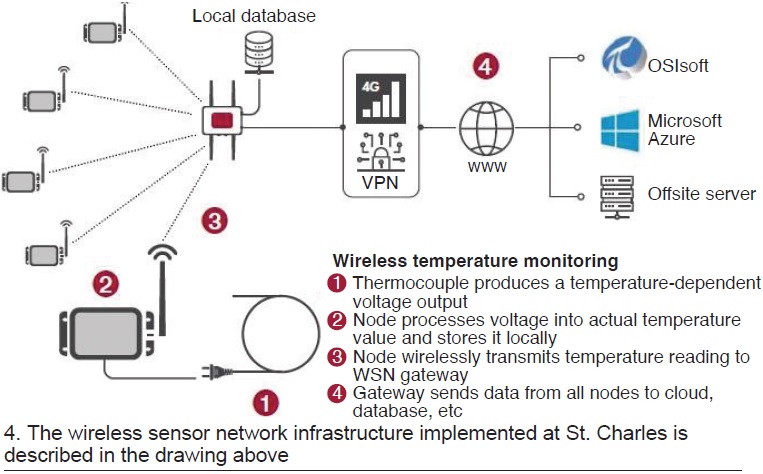
The wireless sensor network consists of two primary components: (1) sensor nodes that collect local sensor data and transmit it wirelessly to (2) a gateway that transfers the data to the PlantTrack database. Fig 3 illustrates SI’s data collection node, highlighting several of its features. Each node has multiple sensor channels and is capable of collecting data from a variety of sensor types. The single node can accommodate up to nine different standard t/cs.
The wireless data-acquisition node is installed in close proximity to the monitored component, and all thermocouples are hardwired to the node. Data from all nodes are transmitted via a 900-MHz wireless protocol to a locally installed Wi-Fi-enabled gateway, which stores the data in a local database until they are transmitted successfully to the PlantTrack cloud database. Once transmitted offsite, data can be accessed through SI’s PlantTrack web interface. Fig 4 summarizes the general wireless sensor network infrastructure implemented at SCEC.
This project has resulted in a highly valuable tool for targeting inspections and planning outage scopes more efficiently. The active tracking of temperature differentials with strategically placed t/cs provides a means to quantify the number and accumulation of thermal-transient events within individual sections of the HEP network.
Inspections are planned and performed based on live data and detected damage rather than calendar time. This amounts to a huge cost saving for the facility. Without this system in place, an event like the HRH failure in 2019 would have required annual piping inspections to ensure a problem is not developing again, but with the active t/c data staff is able to monitor piping in real time to determine if and when an inspection is necessary.
In addition to gathering real-time data, the monitoring system has been configured to send email alerts when events of certain magnitude occur, or based on trends-in-temperature events. SCEC personnel are notified immediately when temperatures climb above set limits and when impingements occur. Quarterly calls are held with subject matter experts from Structural Integrity to review the data and discuss any areas of concern or further operational improvement. PlantTrack Online is also connected to the site data historian, which uses additional sensor data to aid in diagnosing and trending attemperator damage.
In sum, by implementing the wireless HEP monitoring system, SCEC has proactively improved plant safety and reliability, while reducing O&M costs and the potential for losing generation revenue. By routing the data to an online database with integrated analytical algorithms that transform data into operational intelligence, St. Charles is able to make timely and informed decisions about plant operation that will maximize the life of critical components and ensure personnel safety.
Plant personnel at the forefront of this project were Jonathan Bennett, Jacob Boyd, and Nick Bohl.
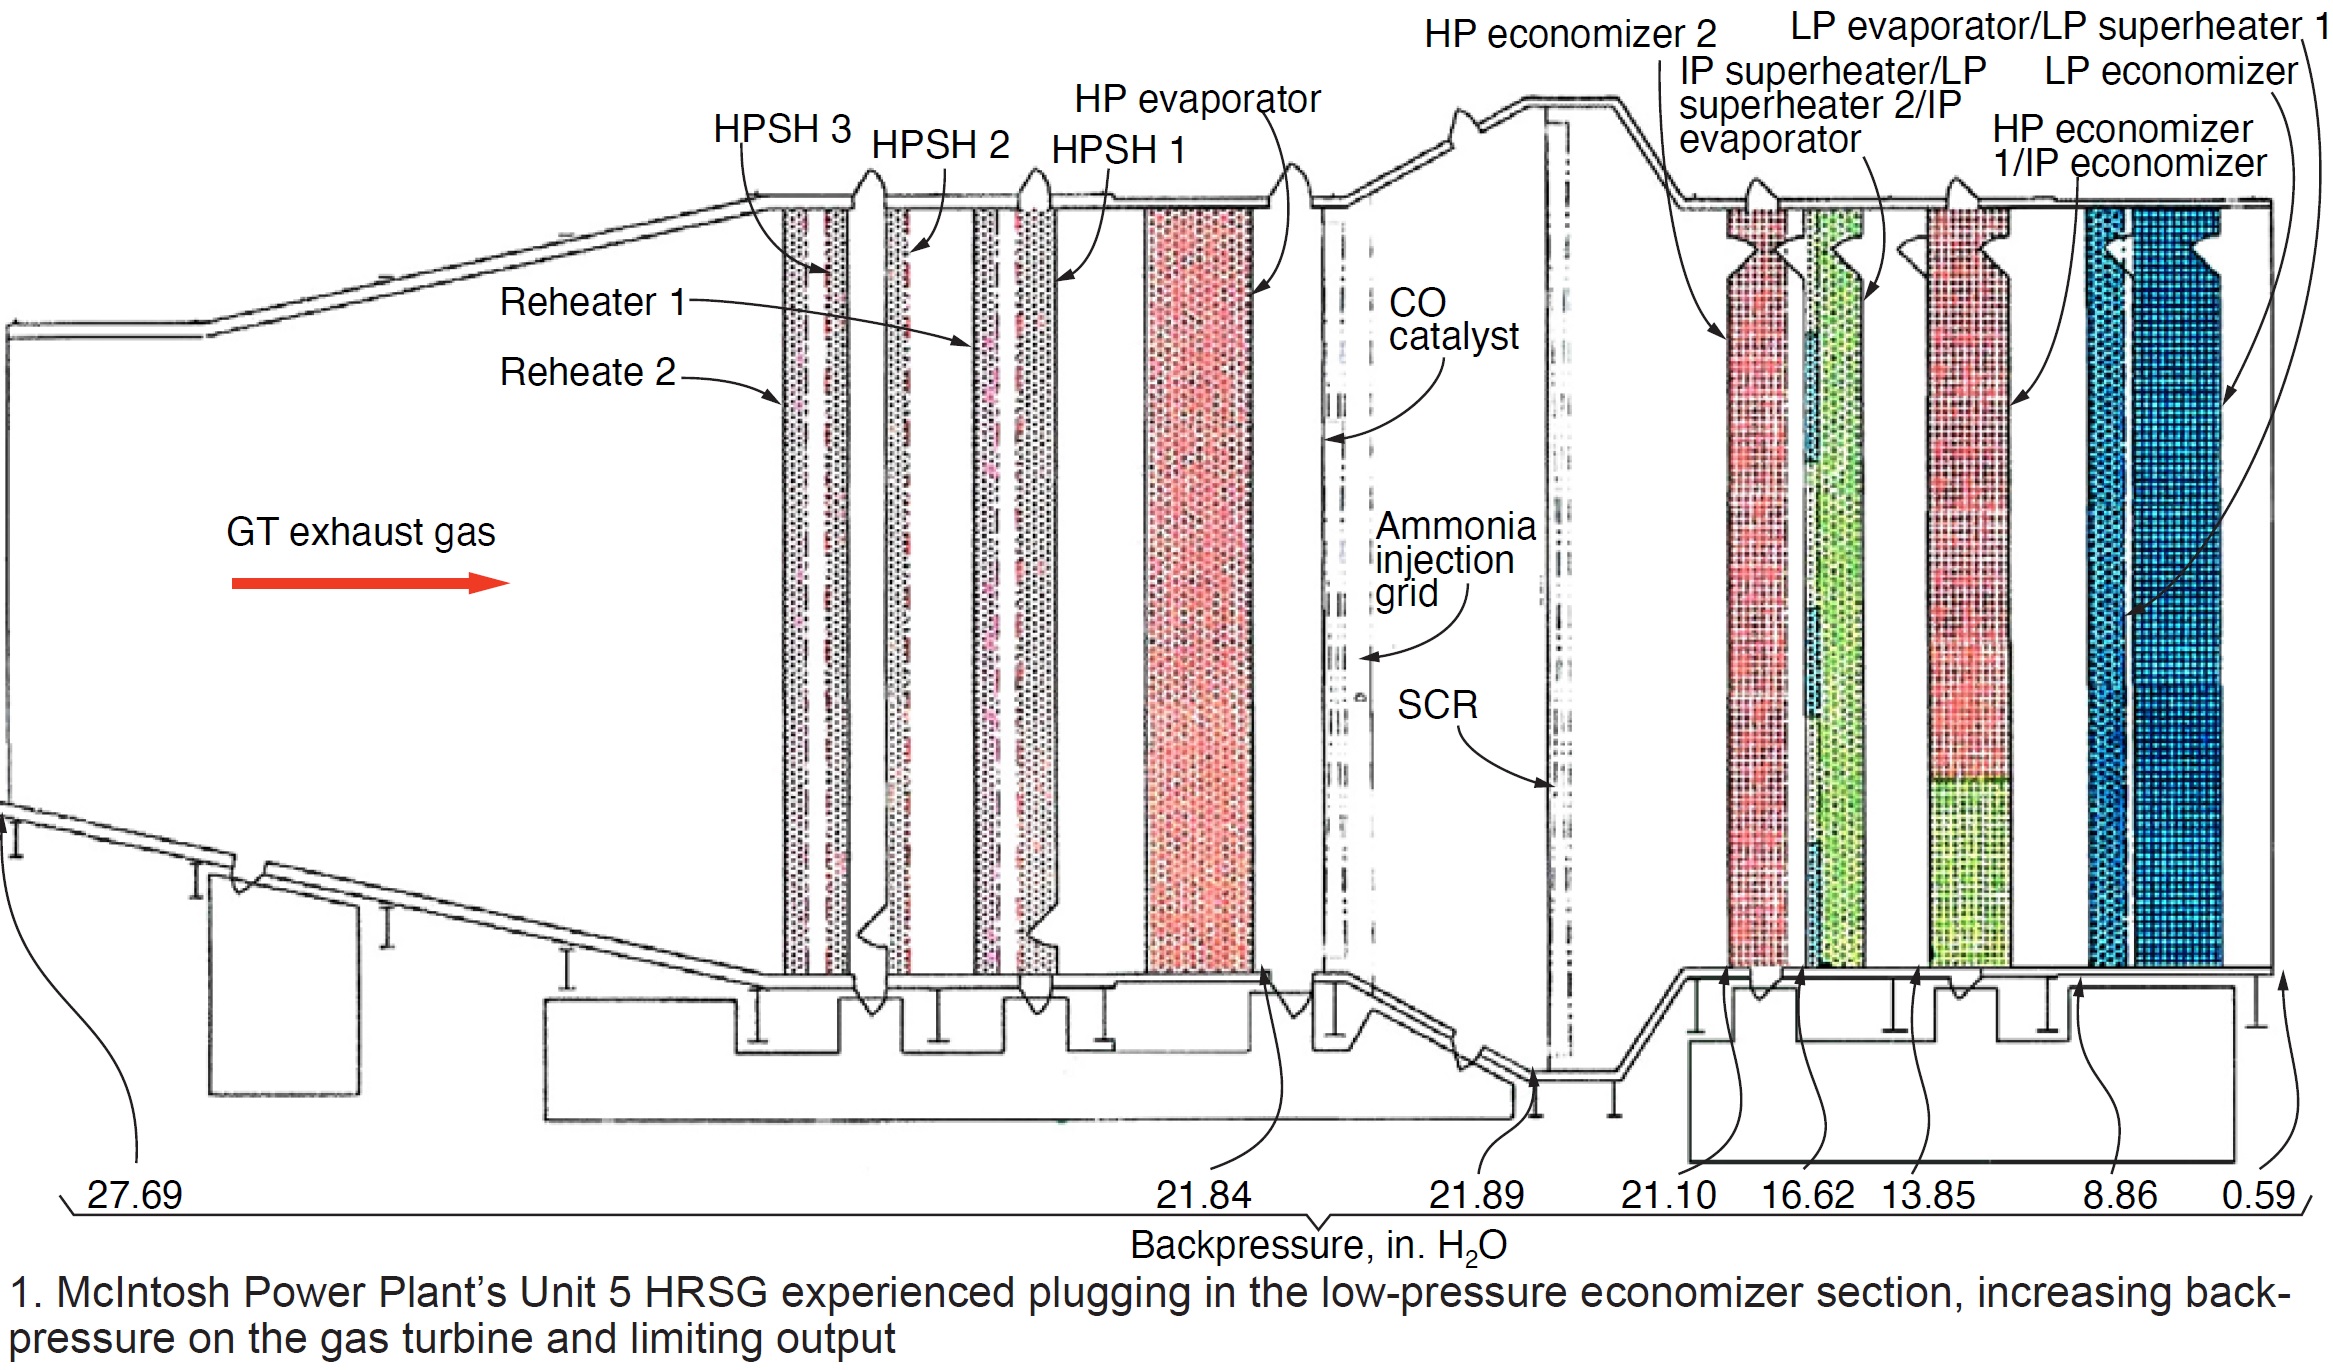
Maximum allowable duct pressure for the HRSG in Lakeland (Fla) Electric’s (LE) McIntosh Power Plant (MPP) Unit 5 combined cycle was 28 in. of water column (in. H₂O). After 20 years of operation, pluggage of the LP economizer in the Nooter Eriksen boiler caused high backpressure on the gas turbine/generator and limited its ability to operate at full load. High backpressure led to a derate of up to 14 MW. Cleaning of the economizer was ineffective in reducing backpressure because of HRSG design idiosyncrasies.
Multiple pressure transmitters were installed on Unit 5 for analysis of the pressure drop across the HRSG to understand when heat-transfer sections are experiencing pluggage and where to focus cleaning efforts during outages (Fig 1). In LE’s case, cleaning did not significantly change the ability to reach full load with an original alarm point of 24 in. H₂O and a runback set at 26 in.
Several modifications brought the allowable backpressure to 29 in. H₂O, with the alarm point reset to 27 in. and the runback to 30 in. Testing showed a significant efficiency gain by allowing Unit 5 to run up to the alarm point. At 27 in. H₂O, Unit 5 had an increase in output of 15 MW, eliminating the derate. Testing and analysis indicated the HRSG would require stiffeners in various locations to increase the design limit from 30 to 45 in.
An engineering firm was engaged to analyze the HRSG and to come up with an adequate solution to increase Unit 5’s allowable duct-pressure limits. The consultant recommended adding 245 stiffeners throughout the HRSG. Stiffener spacing, size, and design were evaluated using best engineering practices.
The engineering firm divided the required stiffeners into these two areas:
- HRSG inlet, reheaters 1 and 2 and HP superheaters 1, 2, and 3.
- HRSG outlet, the HP evaporator and remaining heat-transfer sections downstream to the exhaust stack.
For the first area, engineers evaluated casing stiffener spacing based on biaxial bending (plate theory) to accommodate a duct pressure of 45 in. H₂O. For the second area, stiffener spacing was based on large deflection/diaphragm stresses to accommodate a duct pressure of 45 in. H₂O; this evaluation was used as the basis for stiffener design.
The distinction between the two areas is based on experience that indicates the former should have more stiffening to avoid liner and pin problems as casing pressure is increased.
The design procedure used came from the fourth edition of Roark’s Table :X, which takes into account plate action when designing the casing for internal pressure. This analysis does not include finite-element analysis of the casing, but rather uses traditional mechanics of material theory. The initial design procedure relies exclusively on plant bending in two axes. Another approach is large deflection/diaphragm stresses. This approach recognizes the plate will resist the stresses in bending in both axes but there also is additional resistance—a membrane stress, or direct stress.
Testing and analysis showed Unit 5 had a significant improvement in efficiency and eliminated the derate load output by increasing the allowable duct pressure in the HRSG. To accomplish this, LE completed the following:
- Performed an engineering analysis of the HRSG to determine how many stiffeners and at what locations stiffeners would be required to accommodate an increase in duct pressure.
- Performed a test to show that increasing the duct-pressure limit would significantly improve Unit 5 efficiency by eliminating derates caused by pluggage.
- Added 245 stiffeners during an outage.
- Increased the operating backpressure limit to 27, 28.5, 29, and 29.3 in. H₂O for alarms and 30 in. for runback.
As a result of these improvements, guided by Todd Green, mechanical maintenance supervisor, and Jim Adams, electrical maintenance supervisor, Unit 5 is no longer derated because of HRSG pluggage and is able to make full load when required.
DIG DEEPER ON OCT 13 @ THE HRSG FORUM

McIntosh Power Plant is home to the first W501G gas turbine to experience a turbine-rotor through-bolt failure. The utility worked closely with OEM Siemens to complete an investigation to determine the failure mechanism. While this lengthy process unfolded, the utility invested in several mitigation efforts to minimize the potential for future through-bolt failures. This best practice focuses on one of the mitigation actions—dehumidification—and lists other ideas that were implemented.
There had not been a turbine through-bolt failure in more than 30 years of operating gas turbines of essentially the same design. Therefore, starting from scratch on a root-cause analysis (RCA), early indications pointed to a high stress riser at the Row-1 disc area, where the fracture occurred (Fig 2). An in-depth investigation of all significant materials provided important facts regarding the incident but did not identify a sole root cause.
The theory was that moisture in the rotor air cooler (RAC) circuit could be carrying debris to the Row-1 disc area and creating a debris pack between the rotor and disc. Based on the concern for moisture and debris in the RAC circuit, Lakeland Electric (LE) researched possible mitigation efforts and implemented the most promising.
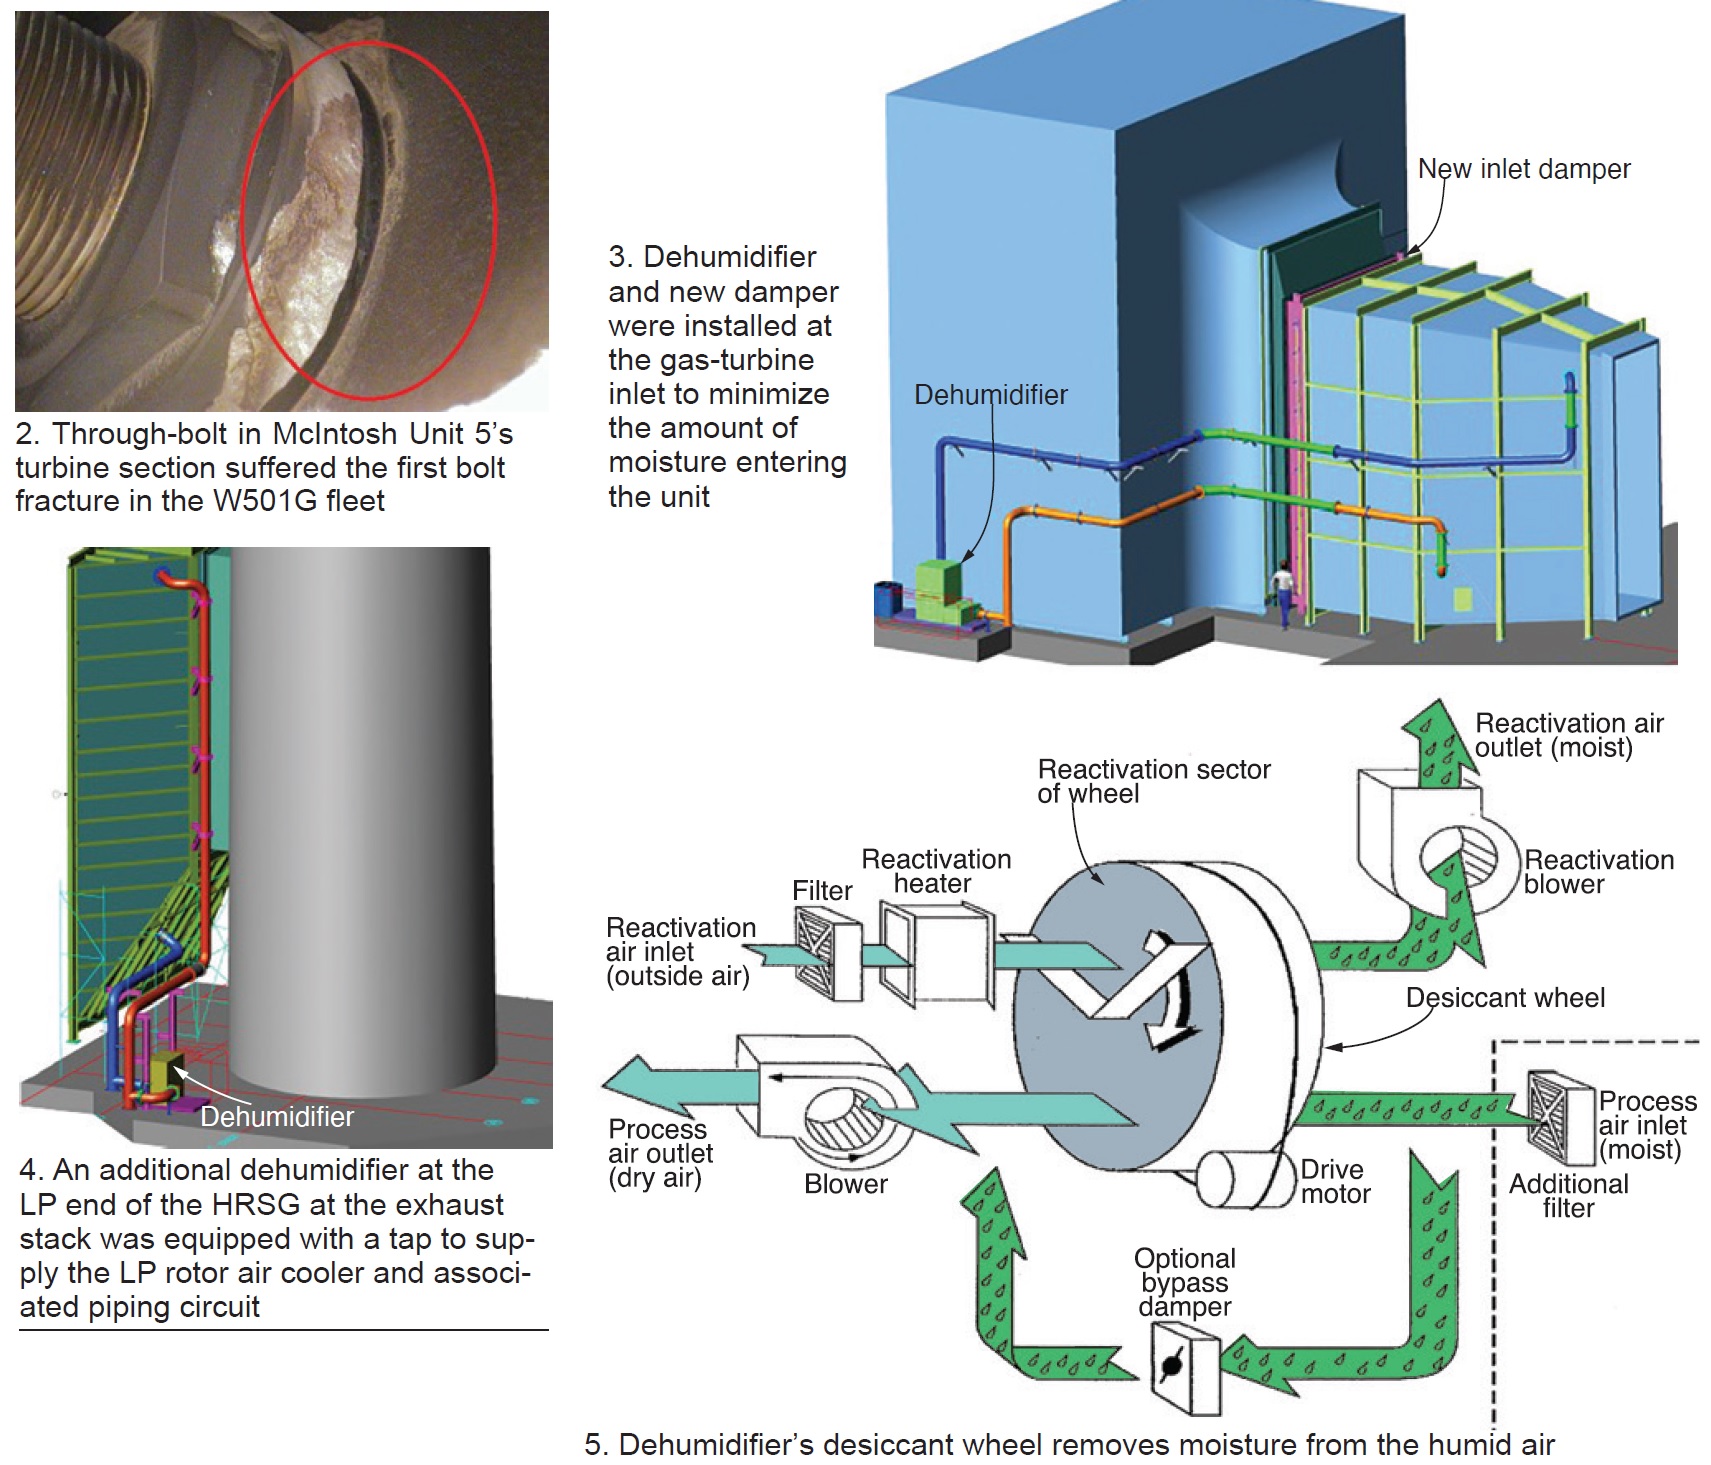
The utility’s first initiative, to eliminate the sources of moisture in the RAC circuit, was to engineer a dehumidifier application for the gas-turbine inlet and add a damper to minimize moisture from entering via the GT inlet (Fig 3). LE also added a dehumidifier to the LP end of the HRSG at the exhaust stack with a tap to feed the LP RAC and associated piping circuit (Fig 4). A damper was not required at the stack because one had been installed previously.
When Unit 5 was brought offline, the new damper allowed LE to “bottle up” the unit. Then the dehumidifiers would be placed into service to help prevent moisture from condensing because of the humid Florida air. This prevented the RAC piping from sweating, creating moisture, and causing corrosion in the RAC piping circuit.
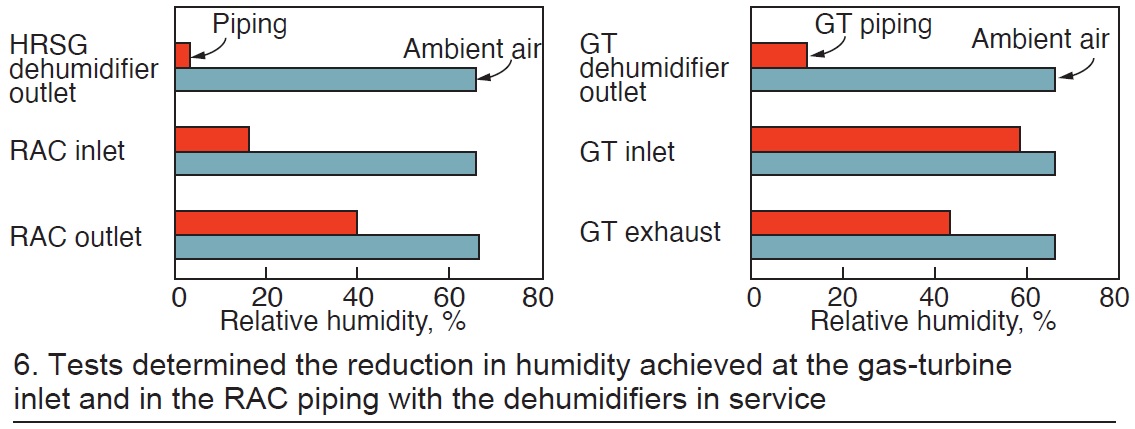
Fig 5 shows how the dehumidifiers work. They are equipped with a desiccant wheel to remove moisture from the humid air; desiccant reactivation is by application of heat to the wheel. Tests were performed to determine the reduction in inlet and RAC-piping humidity. Fig 6 provides test results to illustrate dehumidifier effectiveness.
Other mitigation efforts also were initiated to help control moisture and corrosion in the RAC piping circuit, thereby protecting the rotor through bolts—including the following:
- Developed a hydro procedure for RAC leak inspections and repairs (outage standard).
- Added a thermocouple to the RAC to detect water from a leak. This point was brought back to the plant DCS.
- Added RAC manual drains that are checked during startup of Unit 5.
- Automated the RAC drains to open during turbine startup to blow any moisture to the blowdown tank.
- Installed an additional RAC startup strainer.
- Changed the RAC piping from carbon steel to stainless to eliminate debris.
These enhancements enabled a cleaner RAC circuit and less debris transport to the turbine rotor.
Use of an investigative process enabled LE to implement multiple solutions for reducing moisture and debris from the RAC piping circuit. Specifically:
- The utility implemented solutions developed by its personnel—including Kevin Robinson, operations manager; Guy Tayler, mechanical engineer; and Steve Reinhart, plant manager—and several by Siemens engineers as noted in the list above.
- Siemens eventually redesigned its 501G rotor through bolts and Lakeland has implemented the latest OEM technology and rotor through-bolt design in its rotor upgrade program.
These shared technology advancements have been implemented throughout the W501G fleet and there have not been any rotor through-bolt failures since.

