The first combined cycle began operating in 1999. It was repowered in October 2020 and today the gas turbines are rated 223 MW each, the steam turbine 238 MW. The second combined cycle is comprised of a 182-MW gas turbine called Genelba Plus, installed in 2009 and repowered in June 2019, and a 188-MW gas turbine installed in 2019. The 199-MW steam turbine was commissioned in July 2020.
The plant’s challenge was to develop a means for monitoring critical equipment to maintain Genelba’s availability and reliability at the facility’s traditional high levels.
The solution required creating and implementing a methodology for gathering information from multiple online and offline sources, developing key performance indicators (KPIs), and analyzing them under different boundary conditions as illustrated in Fig 1.
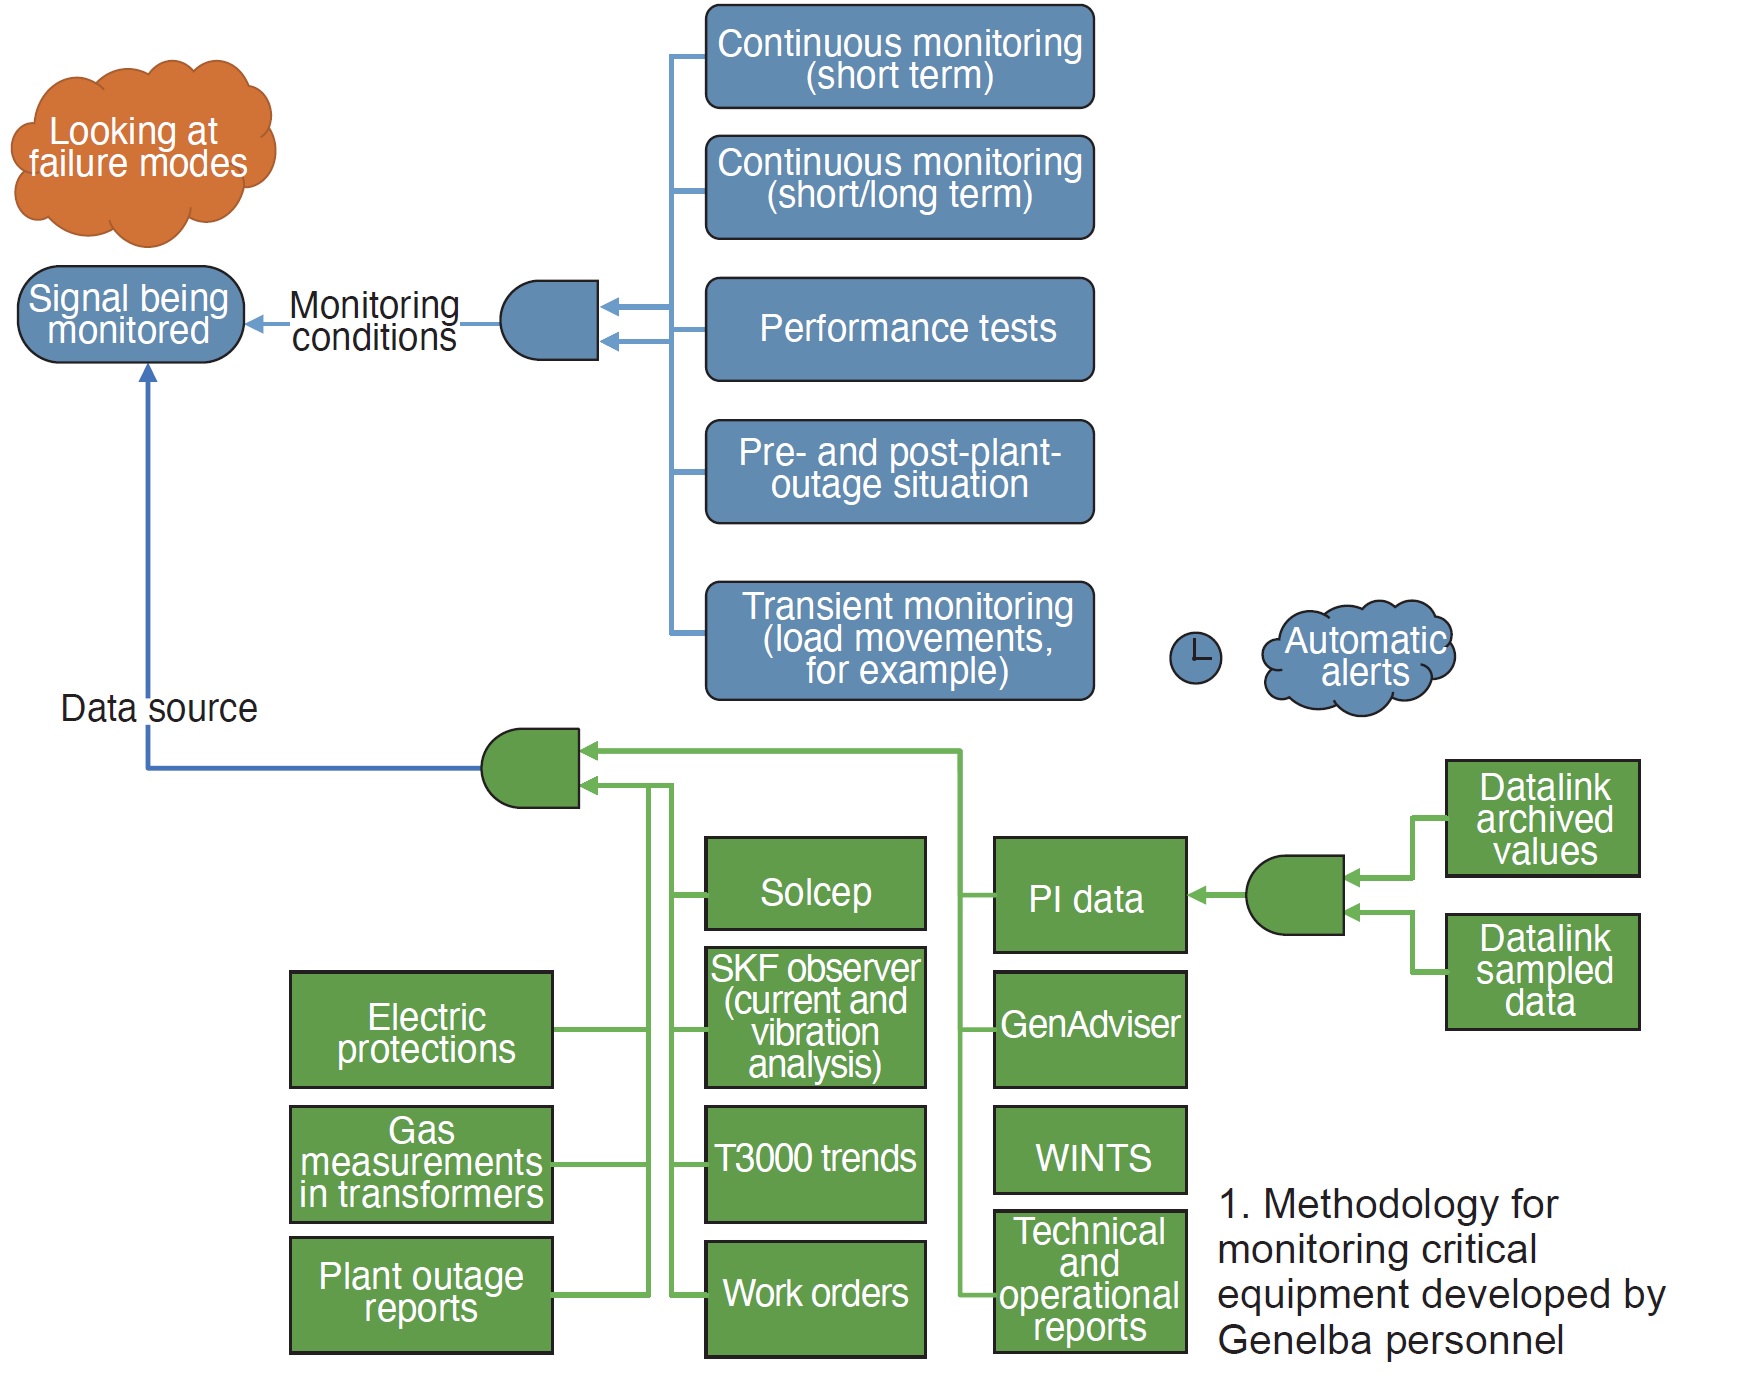
After identifying the available information resources, a process was developed and executed to answer the following questions, which were then programmed in an automatic execution algorithm in PI:
- Is the instrumentation proper and in good working order? Are additional sensors needed to monitor other equipment failure modes?
- Baseline definition (normal behavior).
- Does the signal change over time?
- Are there alarm signals coming from that system?
- What were the equivalent operating hours at the time of analysis?
- Is there a correlation with other variables?
- What consequences does the abnormality have?
- How are the measurements on the other machines?
- Is the system showing signs of failure—for example, is there an increase in the number of work orders?
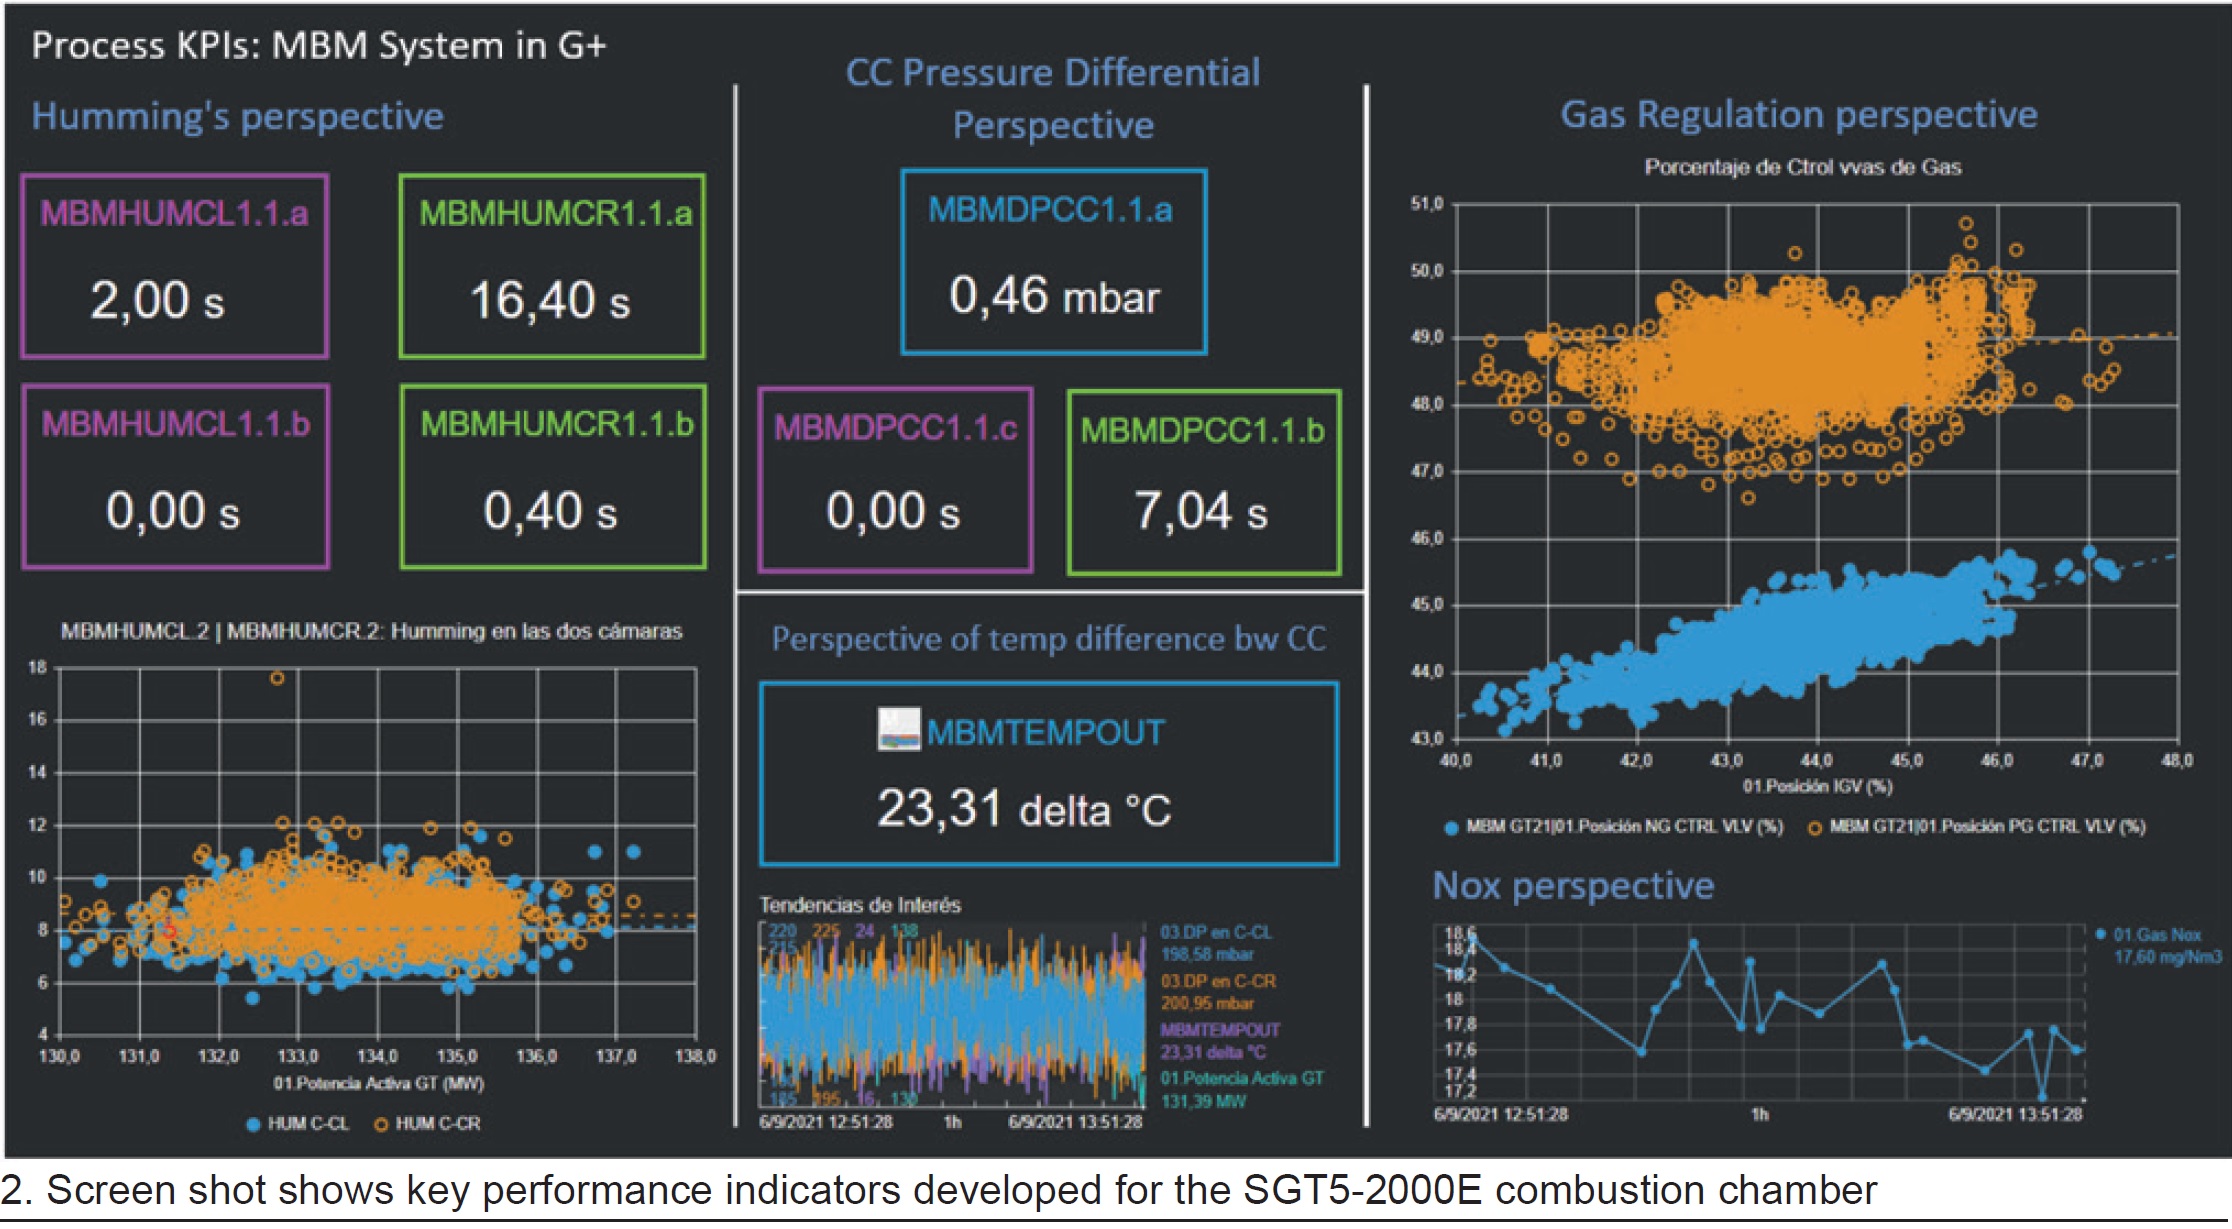
Genelba’s Best Practices entry form offered the following example of how the plant’s program works using the KPI MBMHUM1.1. Four binary signals from the control system are activated when the humming exceeds 20 and 30 mbar. (Recall that the plant’s SGT5-2000E gas turbines each have two combustion chambers.) The indicator counts the total time that both cameras were exposed to humming greater than 20 mbar and greater than 30 mbar in the last 15 days.
Presenting the information in this manner allows staff to analyze, for example, whether the machine was exposed to higher levels of humming after an inspection (where pilot valve control could be intervened). It also affords a comparison between both combustion chambers.
Fig 2 shows the KPI dashboard developed in OSIsoft’s PI Vision for the continuous monitoring of the combustion chambers. Using the methodology illustrated, and keeping in mind equipment failure modes, the plant’s technical experts are able to determine if it’s necessary to add more instrumentation to detect important failures early.
Continuing with the combustion-chamber example, staff found that addition of accelerometers could possibly identify conditions conducive to impending burner malfunction—such as the possible loosening of burner hold-down bolts. Fig 3 shows one of the sensors attached to a base that had to be welded to each burner to dissipate heat so the sensor would work within specifications.
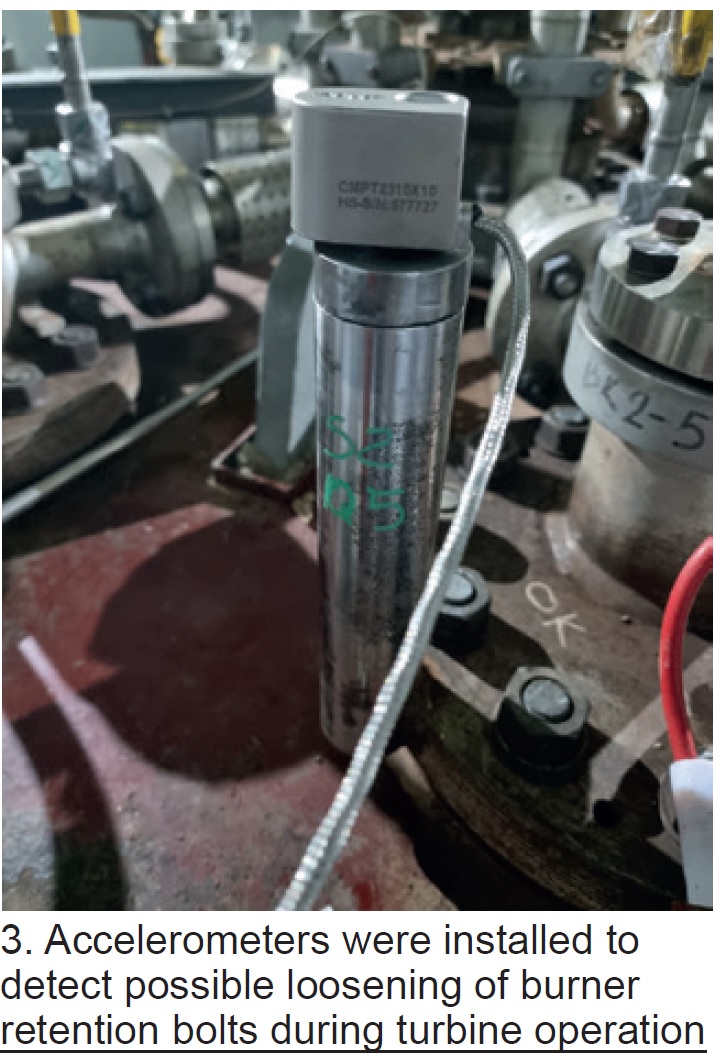
The accelerometer is wired to a high-frequency processor box that transmits the information via the plant’s industrial WiFi network to the processing server.
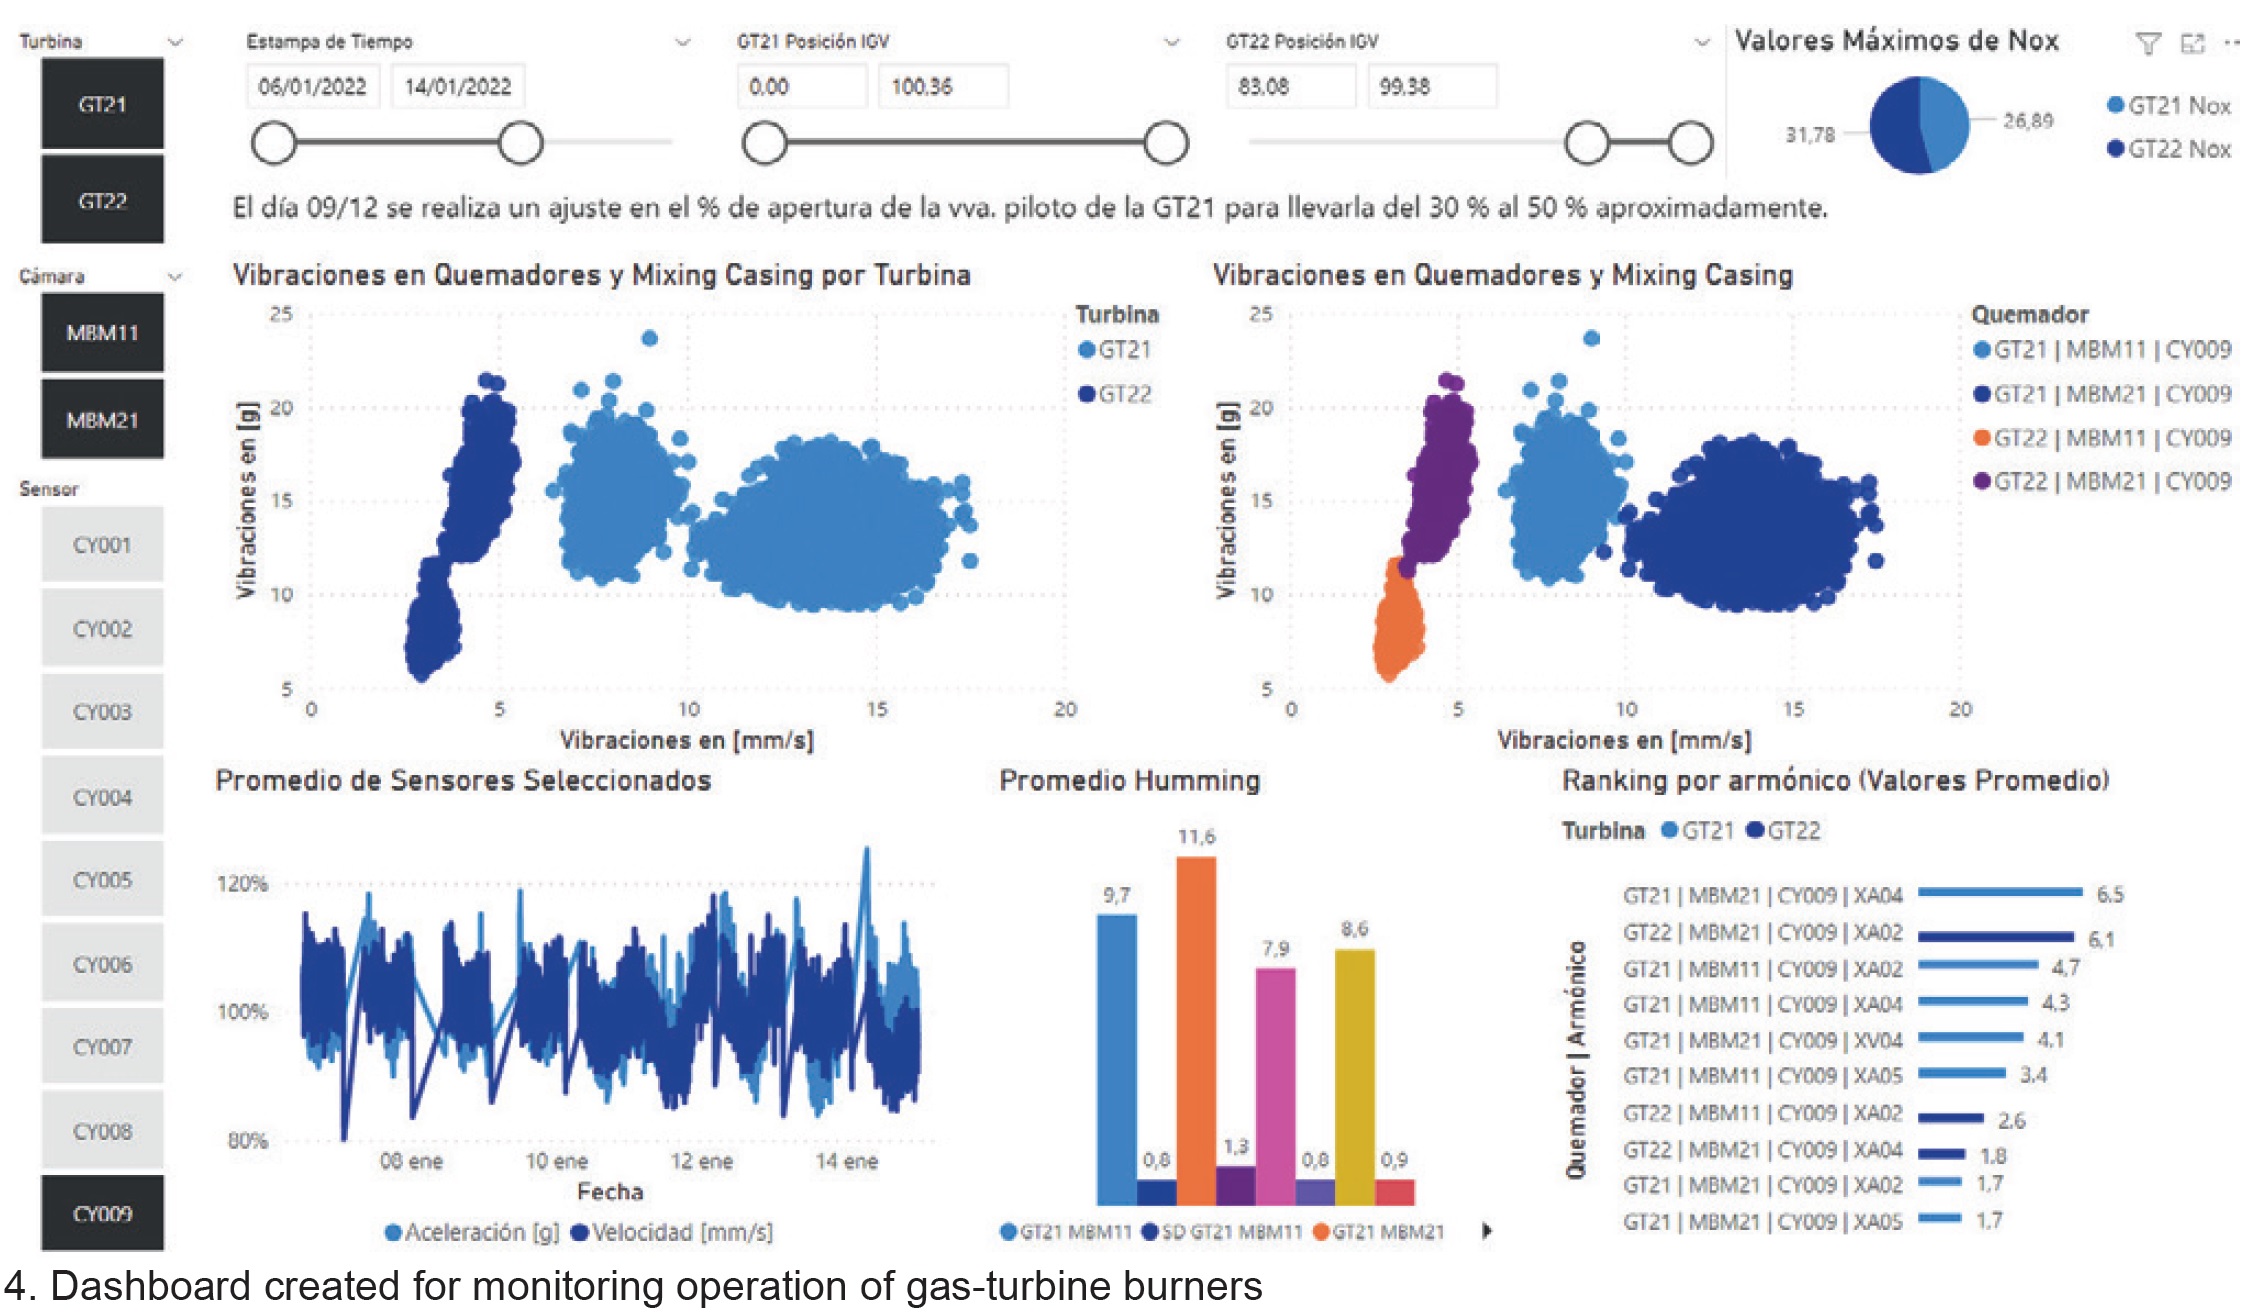
In sum, 18 accelerometers were installed on each engine. Information is sent to the PI system, from which a comparative dashboard was developed by sensor, camera, and gas turbine, with the goal of characterizing the cameras and determining abnormal behavior—because personnel did not have reference limits for these new measurements.
Fig 4 shows the board developed in Microsoft’s Power BI, an interactive data visualization software product, for tracking acceleration measurements. The graph at the upper left shows information from all the selected sensors discriminated by turbine; that at the upper right from selected sensors discriminated by turbine and sensor. The lower graphs show trend values, humming values, and vibrations per harmonic, respectively.
Here’s an example of how the development effort described above works: One of the indicators monitored—it infers thermal balance between combustion chambers—detected a deviation in GT22 of more than 15 deg C with respect to the allowed maximum. Staff analysis determined that fuel flows to one of the combustion chambers required correction.
Technical experts believed the anomaly might have been caused by a deformation in the right combustion chamber of GT22 that allows air to bypass the compressor, cooling it. Such a thermal imbalance over time can stress the first row of rotating blades, with the risk of fracture of some, and consequent damage in later stages.
The temporary fix implemented was to replace a gas orifice plate to redirect more flow to the combustion chamber experiencing deformation, thereby thermally compensating the effect. A permanent repair was planned for the next GT minor inspection.
The benefits of having the intel and implementing a temporary fix included the following:
- Staff could detect wear on the camera and plan resources and work in advance of the next planned inspection. Without such preparation, personnel believed an outage of at least five days would have been required to correct the problem, at an estimated cost of about $250k/day.
- Modifying the orifice plate in the gas pipe avoided progressive damage to GT22 airfoils and mitigated the risk of catastrophic failure.
- The possibility of improving instrumentation to measure humming values associated with GT protection more precisely was identified based on another of the developed indicators.