How to eliminate thermal losses, identify equipment deficiencies
by James Koch, Powerplant Performance Specialist
In the early 1980s, performance monitoring gained emphasis in response to skyrocketing fuel costs following the 1970’s oil crises. At one of the first major heat-rate conferences, a presentation by an expert on ASME Performance Test Codes stressed the value of the PTCs this way: “We need accurate incremental heat rate for dispatch, daily monitoring to optimize operator-controllable losses, trending for prudent maintenance scheduling, and, of course, reports—we all need to write reports.”
Perhaps that was the case 30 years ago, but today’s plant and asset managers don’t want reports, they want solutions. And not just an answer, but the right answer. They need to know that the numbers they’re shown, the recommendations presented, and the suggested course of action to correct performance issues will be justified economically.
Think of it this way: You take your car to a mechanic and tell him it doesn’t seem to be running well. You ask him to keep the car for a few days and check back when he knows what the problem is. Your expectation of the mechanic’s evaluation might be something like the following:
- You’re right, sir, the mileage is down about 5 mpg.
- You need a tune-up to correct the issue.
- It will cost about $150.
- With average use, the repair will pay for itself in about four months.
Plant management needs the same type of service:
- Is my plant not performing as it should be?
- If not, why not?
- What exactly is the problem?
- What is the deficiency costing me in lost revenue and/or excess fuel?
- What work is required to correct the problem?
- How much will the repairs cost?
- Most importantly: Are the repairs worth making?
Performance impacts
Like the way the various engine components affect car mileage, the various components of a combined cycle affect overall plant performance. Furthermore, the performance of each component can be characterized by one or more parameters related to the mechanical or thermodynamic performance of that component.
Fig 1 shows key performance parameters schematically. For example, gas-turbine (GT) performance can be assessed by looking individually at (1) inlet air flow, (2) compressor section efficiency, (3) turbine section efficiency, (4) inlet and exhaust pressure losses, and (5) parameters that may be “operator set-point controllable”—such as the reference exhaust-temperature curve (aka “firing” curve), inlet-guide-vane (IGV) position, and water or steam injection flows.
When the loss in GT output is attributed to changes in these parameters, and a megawatt loss is assigned to the lower-than-expected value (or higher in the case of some parameters, such as pressure drop), then plant management has the information needed to address the same questions as the car owner above, namely:
- What is the problem?
- Is it worth fixing?
GT performance parameters, together with balance-of-plant (BOP) parameters such as steam-turbine (ST) efficiency and condenser cleanliness, can be determined through testing or monitoring, and will point to those components requiring attention to restore overall plant performance. Determining and trending performance indicators, correlating changes in the parameters to changes in unit performance, and understanding how instrument uncertainty affects uncertainty in the perceived (that is, calculated) values of these parameters, are at the very root of analyzing plant performance.
Examples 1 and 2 describe two common problems at combined-cycle plants. In each case, common-sense thinking and basic instrumentation were able to identify the problem, indicate a solution, and show that the proposed fix was cost-justified. These two examples are, of course, for demonstration purposes; it isn’t always this easy.
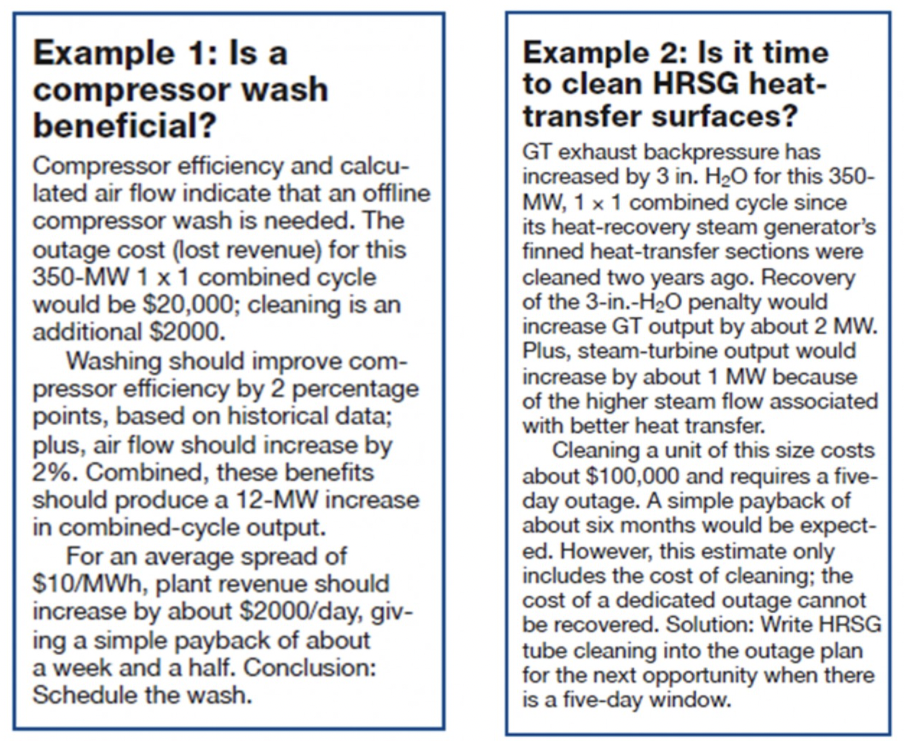
But, while some problems are more complicated, require more pieces of field data, and more detailed analysis, there are also many issues that can be identified with some basic knowledge of plant operation, a few measurements, and some arithmetic.
Getting started. The challenge of today’s plant owners and operators is not simply monitoring and analyzing performance, but doing so in a time of limited budgets, reduced staffing levels, and combined-cycle technologies that are becoming increasingly complex. The last makes accurate analysis more difficult. Critical, too, is that the performance monitoring and analysis effort provide owner/operators a compelling value proposition.
OEMs once shared virtually all information regarding performance curves; you may recall the “thermal kit” for steamers. Try finding the equivalent of that kit for a gas turbine. Usually all that is available is a set of correction curves from the acceptance test. But these aren’t necessarily optimal for performance monitoring—because they were prepared with a commercial purpose in mind. Furthermore, it is not unusual to find inaccuracies in such correction curves.
Common sense rules. Often a plant wants to get started with performance monitoring, but management drags its feet in moving forward because the cost of running a full test in accordance with the ASME PTCs. They recall the manpower, high cost, and complexities of conducting their own contract acceptance tests. Unfortunately, managers too often make a connection between running a Code-level contract test and doing simple, routine trending—and they stop dead in their tracks.
When the purpose of a test is to demonstrate a contract-level of performance, and there are significant damages or bonuses tied into tenths (or hundredths) of a percentage point in the test results, it behooves both parties to run a highly accurate test. It’s likely that each tenth of a percentage point in the results could cost one party or the other many thousands of dollars. This is where high-accuracy, high-cost instrumentation and procedures can pay for themselves by reducing test uncertainty.
But, if the plant is running a simple test for routine monitoring, or trending performance for its own internal purposes, the results do not need to be anywhere near the Code level of accuracy. This is not to say that the monitoring can be done sloppily, or with instruments that are known to be out of calibration or improperly installed.
Rather, the instrumentation and process needs to be of sufficient accuracy (and repeatability) so the conclusions drawn, and the actions taken, are correct. This level of accuracy is significantly less expensive to achieve than PTC-level testing. If fact, almost any plant built since about 1970 should have instrumentation and archival capability to immediately start a successful monitoring program.
As noted earlier, each component in the cycle can be characterized by one or more performance parameters that attest to its efficiency, heat-transfer capability, capacity, cleanliness, etc. But, before jumping into performance assessment with both feet, there are some preliminary steps to take that are well within the reach of most plants.
Accounting. The goal for any performance monitoring program is to improve the facility’s profitability. Two items that can impact the bottom line more than any other are the accuracy of the largest cost stream (fuel expense) and the main revenue stream (power metering). It’s surprising how many facilities don’t perform regular fuel and power-production accounting, using their own in-house instrumentation against over-the-fence revenue meters. And when they do perform these checks, it’s surprising how often the results disagree—sometimes significantly.
A simple check can be done using PI or a similar data archival system. For every hour of the month, tally all of the site’s gas flow meters, and compare that result with what the revenue meter reports. It’s not unusual for a plant to find that the gas revenue meter disagrees with the onsite fuel flow meters by as much as 2%. If there is a disagreement it’s not too hard to find which meter is the one out of calibration by looking for how the difference varies depending on with which GT, or duct burner, is in service or offline.
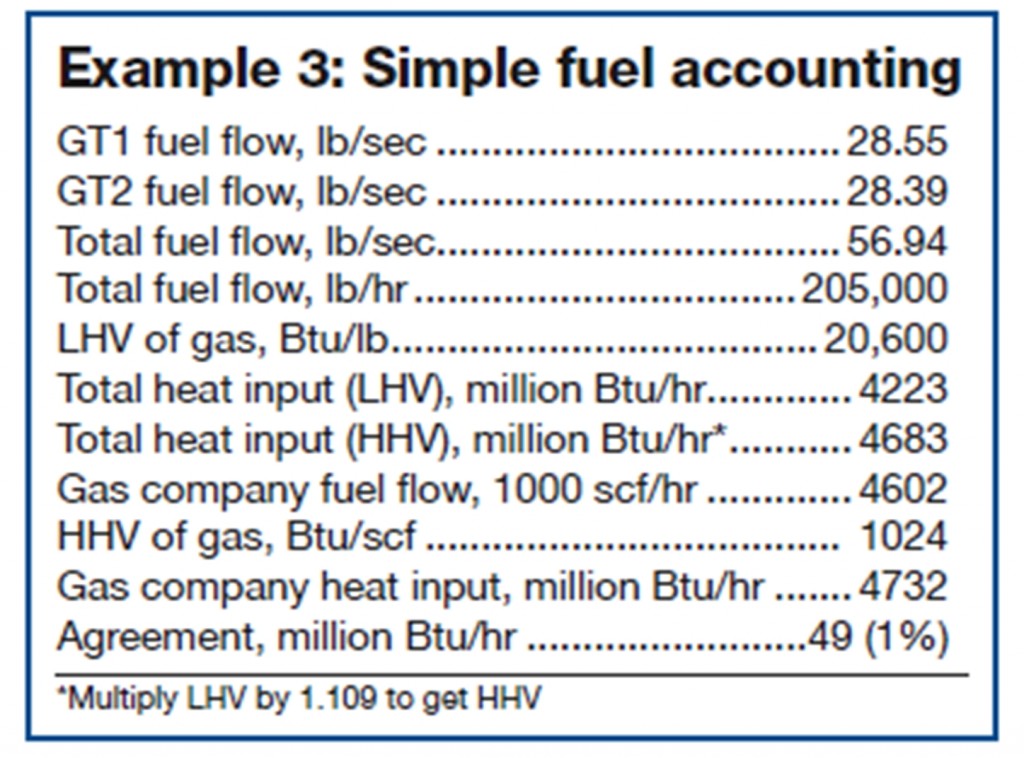
A simple fuel accounting is presented in Example 3. One plant that has been comparing data from its fuel-flow meters against the gas company’s meter for the last eight years or so reported it took a few months to establish its program. First step: Identify and calibrate plant meters providing questionable data. Next, confirm that procedures correcting for temperature, pressure, and gas composition were accurate. Final step: Establish a schedule for verifying flow meter calibration.
Since that time, plant and supplier data have been within 1% of each other—consistently. This result is valuable in two ways. First, the plant knows each month that its fuel bills are correct. Equally important is that for performance calculations requiring fuel flow, the uncertainty is reduced because there is high confidence in measured fuel flow.
The same type of accounting check can be done with generator output, comparing the sum of the GT and ST generators, minus auxiliary power, against the revenue megawatt-hour meter. Like the fuel-meter check, this gives confidence in revenue metering and also ensures the accuracy of data for use in more exacting calculations when they are required.
Corrected output. In combined-cycle monitoring, it is most important to determine the output (overall plant, GT, and ST) corrected for ambient conditions. As most plant personnel are aware, gas-turbine output varies indirectly with ambient temperature.
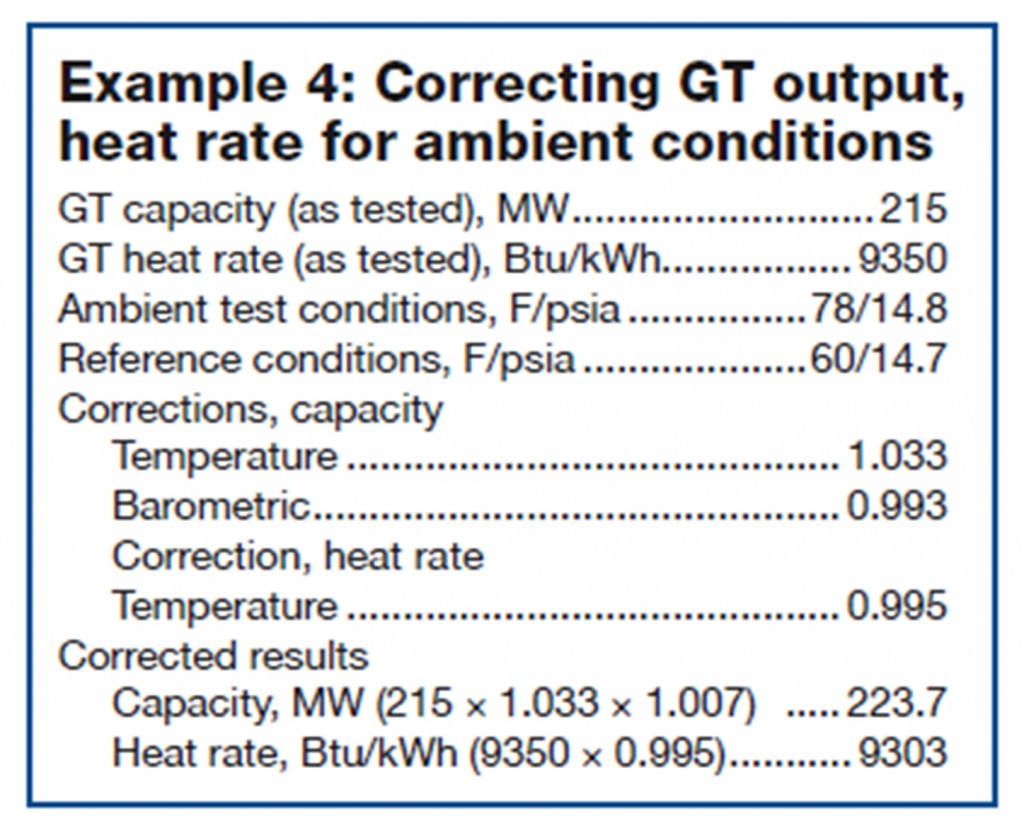
Reason is that the power generated by a GT is proportional to the mass flow of air through the machine; a constant-speed GT takes in air at constant volume flow. Thus, when colder, the air is more dense (that is, there is more mass per unit of volume) and more power is produced. This relationship between temperature and output also holds for the overall combined-cycle plant and generally for the ST. Examples of correction curves are in Fig 2; a simple correction calculation is presented in Example 4.
It is very important to remember the difference between ambient air temperature and the compressor inlet temperature. If evaporative coolers or inlet chillers are in service, the latter is colder than ambient air and the correction on a warm day will be less than if ambient temperature were used. If your plant has no correction curve for output as a function of GT inlet temperature, a curve for a similar GT model can be substituted temporarily for informal monitoring until the actual curve can be obtained or derived.
Keep in mind that GT and overall combined-cycle output also vary with barometric pressure. This correction often is overlooked because barometric pressure doesn’t change much with ambient temperature. Even though there usually is only a small (less than about 2%) variation in barometric pressure day-to-day, its impact on performance may be greater than that of inlet temperature and cannot be ignored. Example: A 2% change in barometric pressure will introduce a 2% error in corrected GT and plant output—a direct one-for-one percentage impact.
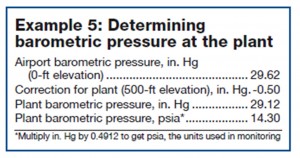
If an accurate measurement of barometric pressure at the plant isn’t available, or if you want to verify the DCS reading for barometric pressure, a nearby major airport is a reliable source. Weather information can be found at the NOAA web site. If the day is calm, and the airport nearby, there is no reason that the barometric pressure measured at the airport isn’t the same as that at the plant. But, be sure to compensate for plant elevation, since airport readings are corrected to sea level for aviation, and are not the local barometric pressure. Example 5 illustrates how to do this.
Compiling actionable information
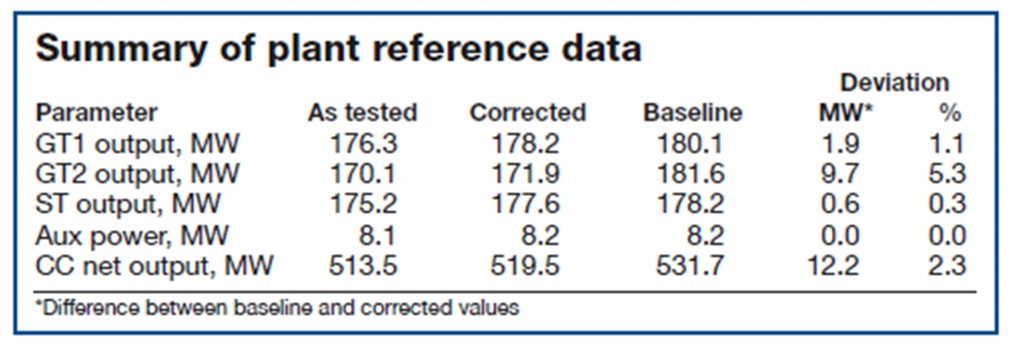
Once you have corrected GT, ST, and plant outputs to say 60F, 60% relative humidity, and 1.7-psia barometric pressure, compare the data to one or more reference points—for example, ISO, the OEM’s original design, the guarantee point, acceptance-test results, or the performance since returning from the last major.
This should be done in an accounting manner, as shown in the table. After correcting as-found plant performance to the reference condition, a comparison against the benchmark performance will point to where the deficiencies are. From the data presented here, it looks as if GT2 may have a problem. Further analysis by an in-house specialist probably would identify the specific issue; so might a performance package. Absent those capabilities, basic arithmetic and thought can direct the plant toward a solution.

Simple-cycle GT. In addition to correcting the output of a simple-cycle GT, it’s important to both correct heat rate and to monitor it on an ongoing basis. Recall that heat rate is the number of British Thermal Units of fuel burned divided by electrical output. Reasoning that the amount of fuel used is roughly proportional to air flow, this parameter can be used as an informal diagnostic to determine if output is not meeting expectations because of low air flow or low internal mechanical efficiency.
Fig 3 illustrates that if heat rate on a given day is the same as it was during an earlier period, but the output is lower, both fuel flow and electric production are down proportionally. It stands to reason that air flow is down as well. Furthermore, since heat rate essentially is the reciprocal of efficiency, if efficiency is the same and output is down, then the internal efficiencies of the compressor and turbine sections are not the problem. This scenario usually indicates low air flow.
But if heat rate is up and output down by roughly the same percentage, then fuel flow is the same as before and air flow most likely is the same as well. In this case, the problem is related to the internal efficiencies of the turbine and/or compressor sections.
As the illustration shows, it’s not possible that the power can be the same but heat rate higher; this would imply that the fuel flow, and hence air flow, have increased. Like output and section efficiency, air flow doesn’t get better by itself. If the calculations for this result are confirmed, then a rigorous check of instrument calibration is strongly recommended.
While more detailed calculations will quantify air flow, compressor efficiency, and turbine efficiency, the reasoning in Fig 3 is a good start for diagnosing engine performance in the absence of more powerful calculations.
The Rankine cycle
In doing the thermal accounting, the next step in the analysis leads to the steam-cycle portion of the combined cycle. If ST output is below expectations, the reason most probably is one of the following:
- HRSG is not effectively making steam from the available heat in the GT exhaust, resulting in low steam flow.
- The expected amount of steam is being generated, but turbine output is lower than expected.
- There is a loss of steam in the cycle. For example, steam may be bypassing sections of the turbine, or perhaps it is being dumped directly to the condenser.
- The cooling system is unable to achieve the design vacuum. Perhaps circulating-water flow is low or the cooling-water inlet temperature is high.
If you have experience with conventional fossil-fired steam units, recall that flow measurement is all-important for analyzing steam-cycle performance. Most combined cycles, like coal-fired plants, are equipped with similar instrumentation to measure flows of condensate, feedwater, and steam (Fig 4).
In addition to direct measurements of steam and water flows, there also are indirect flow measurements that offer a valuable check. To illustrate: If fuel flow and GT generation are reliable, as discussed above, it is possible to calculate a reliable value for exhaust-gas mass flow. This result can be used together with stack temperature to determine the total amount of heat transferred in the HRSG. The result either will confirm the measurements of water- and steam-side flows or alert the plant that these meters may be in error and in need of calibration.
Another way to measure flow indirectly: Use boiler-feed and condensate pump curves and measured discharge head. While not acceptable as a primary flow measurement for contract testing, these parameters provide another check on condensate and feedwater flows for routine monitoring.
Flow versus pressure. One sometimes overlooks performance-loss results when steam is bypassed to the wrong place. Such losses traditionally are found by survey, using an infrared heat gun. But this can be time-consuming and usually is done only periodically. A way to narrow down the potential places where steam is being lost is to use stage pressures as a flow meter to find isolation losses.
When learning how to perform a heat balance, one of the first principles taught is that stage pressure varies as flow to the following stage. With this simple rule, you can use steam pressure (or in the case of the GT, air pressure) as a flow meter. More specifically, a lower-than-expected stage pressure indicates that flow through the following stage will be lower as well. The takeaway: There may be an isolation loss of steam just before that pressure measurement.
This “trick” has been used with great success in both combined cycles and conventional steam systems for years. Plants can use lower-than-expected upstream stage pressures to identify valves to the condenser that are leaking. For example, if reheat pressure is down, say 5%, it follows that there may be a 5% loss of flow to a condenser drain.
For a combined cycle, “finds” in the steam cycle are especially valuable because they represent “free energy.” Keep in mind that correcting a performance loss in the ST cycle does not require additional fuel to the GT as would, for example, the need to increase air flow. Thus, the extra ST output after the problem is corrected is pure profit for the facility. Revenue produced at no cost is added to the bottom line.
Cooling-system delta Ts. The second best “trick” in the book is to use some simple temperature readings around the cooling system to identify/locate problems associated with the heat-rejection process (Figs 5, 6). Each of the three temperature differentials identified in the right-hand columns of both figures relates to the performance of one cooling-system component (tower, circ-water flow, and condenser heat-transfer resistance).
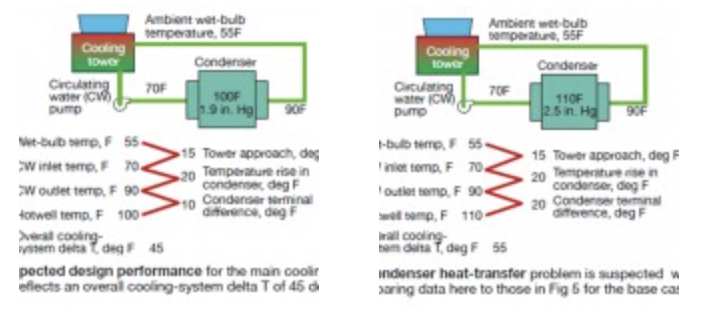
These differentials easily can be compared to their design values, the values seen during acceptance tests, or the values from a previous time (of similar ambient conditions) when the plant believed no problem existed. If there is a significant issue, it can be identified easily with this simple approach.
Again, there are methods to determine these parameters with greater accuracy (that is, more complicated calculations), which will better correct for external conditions—such as plant load and ambient conditions. But if plant personnel suspects a given cause of higher-than-expected backpressure, this simple technique seldom fails to find the culprit.
Root cause. To make the performance-monitoring process truly valuable to the plant, it’s critical that the analysis not stop simply with a report that states the main problem is caused by, say, “low GT inlet air flow.” This condition can be attributed to many things—each of which is related to the physical condition of the filters, IGVs, and/or the first few stages of the compressor.
Similarly, any lower-than-expected performance parameter, if calculated correctly, is caused by some aspect of the physical condition of that component. Like in the car-mileage example above, making the connection between the observed deficiency to a proposed solution is what separates a successful performance-monitoring process from just a report.
Tools of the trade
Good instrumentation is required for the level of monitoring described, but bear in mind that “good” and “expensive” aren’t necessarily related. There are many references to the PTCs when discussing performance monitoring. However, for the purpose of monitoring for degradation, the objective is not comparison to an absolute baseline (such as a contractual guarantee), rather change relative to a baseline. The bottom line: Much of the philosophy behind the PTCs is inappropriate for routing monitoring and trending.
If the same instruments used to establish the baseline are used in monitoring, and if they are calibrated with reasonable care, they should have the accuracy and repeatability required for conducting a successful performance assessment program.
Heat-balance program. After the plant engineer becomes more familiar with the theory and application of performance monitoring techniques, he or she will want to take the next step, which will require a more powerful tool—a heat-balance model. This is a computer program that can predict performance given a set of inputs—such as percent load, ambient conditions, etc—or can back-calculate equipment performance when test data—such as flows, pressures, temperatures, and plant output—are entered.
If you already have a heat-balance program, devote as much time as you can to learning how to use it correctly; make full use of any user support offered. If you don’t have such a program, consider investing in one. Keep in mind that the old adage of “garbage in/garbage out” applies as much as for any computer tool. While they may look easy to use, these programs are complex tools. It will take a while before a newcomer is capable of making meaningful recommendations using the results of any but the most basic heat-balance cases.
How to start. If a plant doesn’t have a performance monitoring process in place, now is a good time to start. Years ago, when utilities dominated the power-generation business, they and the architect/engineers serving them had budgets to support graduate engineers as the learned the ins-and-outs of heat balance, performance testing, and heat-rate analysis. Writing reports was one way to teach and develop young staff members.
Those days are long gone. Although ISOs and price bidding have replaced power pools and incremental heat-rate curves, the need for accurate performance curves, identification of losses, and cost-justifying performance-related maintenance are more important than ever.
Today’s options
Performance monitoring is necessary and can be done; it’s just a matter of “how.” There are three typical approaches: Assign the responsibility to (1) an expert attached to the central engineering staff if your organization has one, (2) a capable plant employee, or (3) a third-party specialist.
Support personnel available. For plants owned and/or operated by a generating company with an engineering support organization, performance monitoring is a relatively straightforward proposition. The support staff usually has a performance engineer with a budget for analyzing performance and improving one’s skills and knowledge base. Other staff personnel usually are available for developing procedures, tools, spreadsheets, etc.
There are several fine software programs and “packages” available for an individual with the time and expertise to use them correctly. Example: One staff engineer chose a “package” suitable for both control-room operator displays and engineering modeling. With serious effort, he developed himself into the company’s performance expert. The screens selected are used productively by operators and management alike, and the software vendor usually provides excellent support and updates.
Plant on its own. For plants that don’t have access to a dedicated support staff, performance monitoring isn’t impossible, but it requires a different approach. The first step is to identify the proper individual to handle the assignment. The ideal candidate will have the following capabilities/attributes:
- Basic knowledge of thermodynamics, heat transfer, and fluid mechanics.
- Skill in performing calculations.
- Proficiency with spreadsheets.
- Common sense.
However, this approach isn’t necessarily the way to go for the small standalone facility, or one in a small portfolio of plants, where staffing is limited and the plant engineer already serves as the de facto compliance officer, chemist, metallurgist, rotating-equipment specialist, etc.
The performance guy (or gal). A cost-effective method for providing your plant the performance monitoring services need is to use what could be called the “water chemistry” model. Virtually all plants without direct access to a corporate or on-staff chemist has a water-chemistry rep who visits regularly, knows the plant’s water chemistry needs, and is usually the first number on auto-dial whenever there’s a water-related question. He or she typically is treated as a “member of the family,” seated on the same side of the table as plant personnel in vendor discussions, to provide technical assistance and protect the plant’s interests.
A plant with limited staff resources could follow the same approach for performance management. This independent expert can provide periodic performance reports with trends, bullet-point items of concern, observations, and recommendations. With Internet conferencing, it’s easy to have meeting with plant management, operators, I&C, and maintenance personnel. Plus, when technical discussions with the OEM are required, there will be a performance professional on your side of the table. CCJ
Jim Koch has more than three decades of experience in heat-balance and plant-performance work. He has spent the last half of his career in private practice; previously, he was employed by an electric utility and architect/engineer. Education: BS and MS degrees in Mechanical Engineering from Rensselaer Polytechnic Institute.
To dig deeper into the subject matter described, write jameskoch@verizon.net for a copy of the author’s technical paper, “‘Common sense’ performance monitoring for combined-cycle plants in a competitive industry.”


