

Boiler efficiency controller improves performance through process automation
 BASF Geismar – BASF Chemical Co
160-MW, gas-fired, 2 x 1 combined cycle cogeneration facility location in Geismar, La.
Plant Manager: Jerry Lebold
Challenge. Boiler combustion controls are designed to optimize the air
flow to the fuel flow rate such that sufficient air (oxygen) is available for complete combustion and the amount of performance-robbing excess air is minimized. Recall that insufficient air results in the formation of excess carbon monoxide, a regulated parameter, as well as a loss in efficiency because of incomplete combustion.
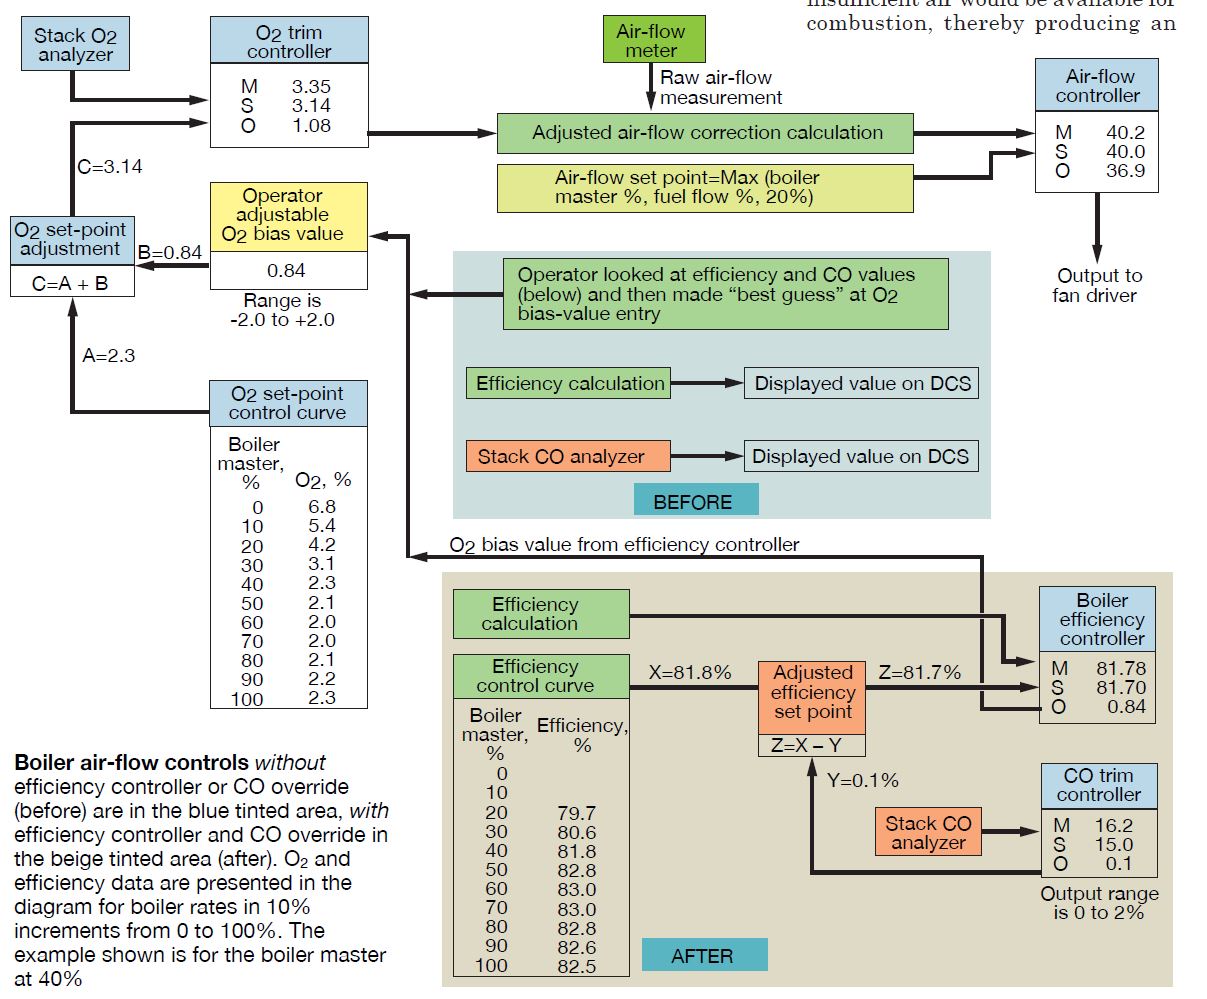
Part of the air-flow controls programming at BASF Geismar allowed for operator adjustment of the stack O2 set point value—an O2 bias value. An operator could enter a negative bias in an attempt to lower stack O2, thereby increasing boiler efficiency. But if the O2 value were reduced too much, insufficient air would be available for combustion, thereby producing an excessive amount of CO. By contrast, if the O2 bias value was set too high, an excessive amount of air would be used, leading to inefficient combustion.
Powerplant board operators have many duties and do not have the time to babysit the O2/air controllers to fine-tune the O2 bias value and to make adjustments each time boiler load or fuel composition changes. To avoid nuisance CO alarms, operators typically would set the O2 bias to a high value, contributing to inefficient operation.
Solution. Initial solutions revolved around trying to give operators target efficiencies to hit, thus letting them know at about what point the CO would “break-through.” This was only moderately effective because the target efficiency varied with boiler load and fuel composition, and occasionally CO break-through would occur before the target efficiency could be reached—for one or more of several minor reasons.
Plant personnel ended up modeling boiler efficiency over a wide range of operating conditions and fuel compositions and created characterization tables that could calculate an accurate efficiency target for the given operating conditions. This model was used to generate a set point for an efficiency controller, which when in automatic, would compare the actual boiler efficiency to the efficiency target (set point) and adjust the O2 bias automatically.
The efficiency controller automatically lowers the O2 bias value until (1) the target efficiency is reached, (2) the CO level starts rising (at which time the efficiency set point is adjusted lower, thereby increasing the O2 bias value), or (3) the minimum O2 bias value limit is reached. In essence, the new efficiency controller automatically adjusts the O2 bias value to achieve the target boiler efficiency, and the CO controller is configured to adjust the efficiency set point on the efficiency controller should CO emissions rise too high.
Control schemes, before and after the staff effort, are illustrated in the diagram.
Results. The efficiency controller and CO override controller have worked very well. Operators no longer have to adjust the O2 bias value as it now is generated automatically. The boilers operate at the targeted values and any CO excursions are handled automatically without operator intervention.
Project participant
J C Rawls, BASF-Geismar Utilities Dept Technology Engineer
Plant equipment meeting expectations? Check the performance dashboard
Challenge. Develop a tool for the operations staff that provides a simple and intuitive display of the performance of various systems and equipment and is easy to use. Critical to the development of a user-friendly performance dashboard are the following:
- Identify the proper key performance indicators (KPI) to monitor.
- Model equipment/system performance accurately to provide appropriate target values under varying operating conditions.
Solution. The KPIs selected for monitoring included gas-turbine output and heat rate, boiler efficiency, steam venting, steam letdown through PRVs, specific power consumption for compressed air, and purchased steam.
Some KPI target values were a constant value—such as zero for steam venting NS 70,000 lb/hr as the target for purchased steam. However, many KPI targets vary with operating conditions.
For instance, the expected efficiency of a boiler is not a constant value but varies based on boiler load, changes in fuel composition, etc. Similarly, gas-turbine output varies considerably with ambient-air temperature.
Equipment and system performance models were developed for a wide range of operating conditions. At BASF-Geismar Utilities, most of the modeling was based on real-life operating data collected when the equipment was known to be operating well. Thus, the operational targets are proven performance metrics and not necessarily based on new equipment design data, which in some cases may not be appropriate.
Because of the varying targets for different operating conditions, performance indices were developed for many of the KPIs. A performance index is a calculation to gauge how well a piece of equipment, or process, is meeting its defined expectation—or more simply, its target performance. A performance index of 1.0 indicates the equipment/process is exactly meeting its goal; a higher score, exceeding expectations; a lower score, not meeting expectations.
For processes measured by a value that increases with improved performance, the performance index is the actual performance divided by the target performance. To illustrate, if at a given condition boiler efficiency is expected to be 82.0% but the actual performance is 82.4%, that performance index would be 82.4÷82.0 = 1.005. The result is greater than 1.0, indicating satisfactory performance.
For processes measured by a value that decreases with improved performance, the performance index is the target value divided by the actual performance. An example is gas- turbine heat rate, a measurement of fuel consumption divided by the unit output. If the expected heat rate of a gas turbine is 12.0 million Btu/MW and the measured (actual) performance is 12.25 million Btu/MW, the performance index would be 12.0÷12.25 = 0.9796. The result, being less than 1.0, indicates poor performance.
The performance index is not useful for comparing the performance of two unlike pieces of equipment. For instance, if equipment A, which normally produces 80 units per day instead produces 85 units is compared to equipment B which normally produces 100 units per day but instead produces 95 units, the performance index score for equipment A would be higher yet equipment B still produced more units. But if one does not look at the performance index value, one might think equipment B is doing well because it is out-producing equipment A while in fact it is underperforming its expectations.
Results. The dashboard created (figure) shows the KPI data together with a green, yellow, or red indicator light—to provide an instant indication of performance. An Excel spreadsheet was used to download the necessary process data from AspenTech Explorer and perform the necessary calculations.
The performance data displayed shows average values for periods of one, four, 12, and 24 hours along with the current performance. Providing data in this format allows performance trending.
Note that the small button with the “T” is a quick link that opens a trend graph for that particular parameter. Another quick link at the bottom of the dashboard opens a troubleshooting file which can be used as a guide to correct poor performance.
To create some competitive spirit among operators and shifts, there’s a “score” in the top right- hand corner showing the number of green lights compared to the maximum possible number of green lights. Current performance data are not included in this score as it changes on a minute- to-minute basis.
For the dashboard shown, the first three rows of performance data are KPIs monitored using performance indices with target values that vary with operating conditionS; the bottom row of data are KPIs that have fixed target values.
From this display you can see boiler No. 4’s efficiency performance was unsatisfactory but improved. Similarly, steam was vented hours ago but the vent is now closed. Condensate return rates dropped and are still marginally low and should be investigated/addressed.
Data displayed in this manner does not tell, for instance, which boiler is operating most efficiently, but rather indicates how the actual boiler efficiency compares to the expected performance.
Project participant:
J C Rawls, BASF-Geismar Utilities Dept Technology Engineer
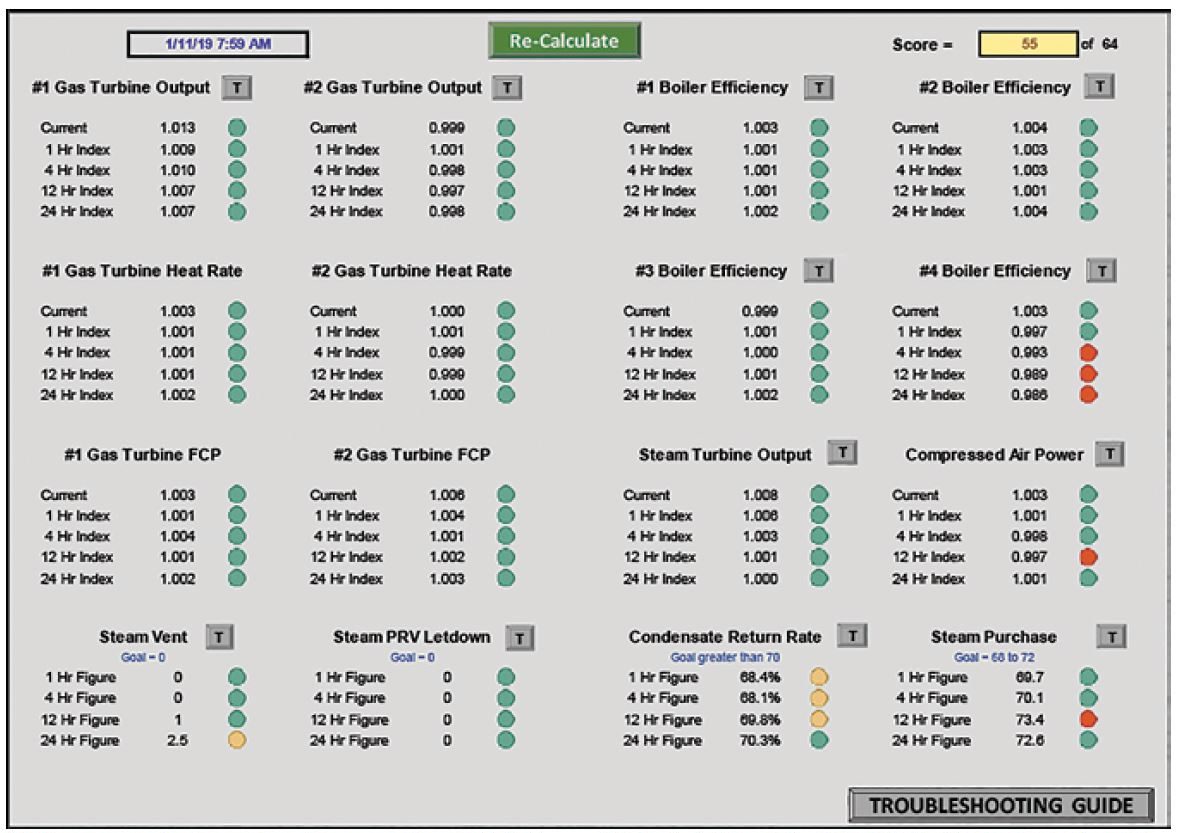
Performance dashboard enables operators to tell at a glance if a particular system or piece of equipment is meeting operational expectations by the color of its indicator light. The data shown account for changes in the performance target as operating conditions vary. The “score” at the upper right reflects the number of green lights among the 64 calculations presented. A troubleshooting button at the bottom right provides operators methodology for bringing off-normal conditions back into spec