

Healthy condenser makes for an efficient plant
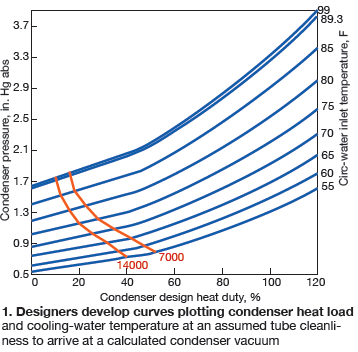
Main-condenser vacuum is a primary driver of steam-cycle efficiency. Powerplant designers develop curves plotting condenser heat load and cooling-water temperature at an assumed tube cleanliness to arrive at a calculated condenser vacuum (Fig 1). These curves then can be used by the O&M staff to verify operation at or near design conditions.
However, the curves, as provided by the condenser manufacturer/EPC contractor, are of limited practical value to operations personnel. For example, they do not provide the following:
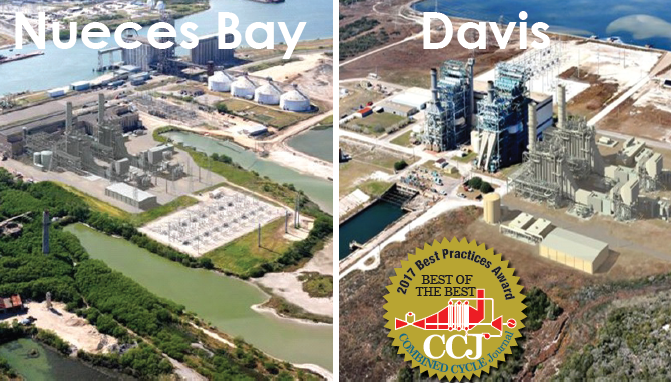
- Data that are easily accessible during transient conditions. Many units in Talen Energy’s combined-cycle fleet, like the 2 × 1 F-class Nueces Bay (670 MW) and Barney M Davis (648 MW) Energy Centers, both located in Corpus Christi, Tex, change load frequently to follow market opportunities. Plus, inlet circulating-water (CW) temperature can vary by several degrees throughout the day because of ambient conditions.
- Historical data to trend changes in deviation from design curves over time. This could provide valuable information to plant management for determining when to perform condenser maintenance as well as to quantify the effectiveness of maintenance performed.
The challenge was to develop an operating metric that could improve upon the design curves provided. The Nueces Bay and Barney Davis staffs came together to develop the solution described below. It can be implemented fairly easily at many other plants, possibly yours, to improve performance and predict maintenance needs.
The condenser heat duty presented on the abscissa of the design curves is proportional to steam turbine/generator (ST) output. The performance improvement team’s first step in developing a practical operational metric was to convert the heat duty on the x-axis to applicable ST output values in megawatts. The curves then were converted to mathematical formulas that could be programmed into the plant’s distributed control system (DCS).
The DCS can interpolate between the discrete curves to allow analysis at any CW inlet temperature. By inputting the actual ST output and CW inlet temperature into the appropriate formula, an as-designed condenser vacuum can be calculated. This then can be compared to the actual vacuum.
The difference from actual to design is called the condenser design vacuum deviation (CDVD). As a DCS-generated value, CDVD can be used by operators to gauge condenser efficiency in real time during both steady-state and transient operations.
In addition, the CDVD can be logged in the plant data historian to trend condenser performance. This can be used by maintenance team members to determine loss of condenser performance, or restoration of performance post-maintenance.
The performance-improvement team cited several instances of CDVD being used for determining vacuum leakage problems. They are:
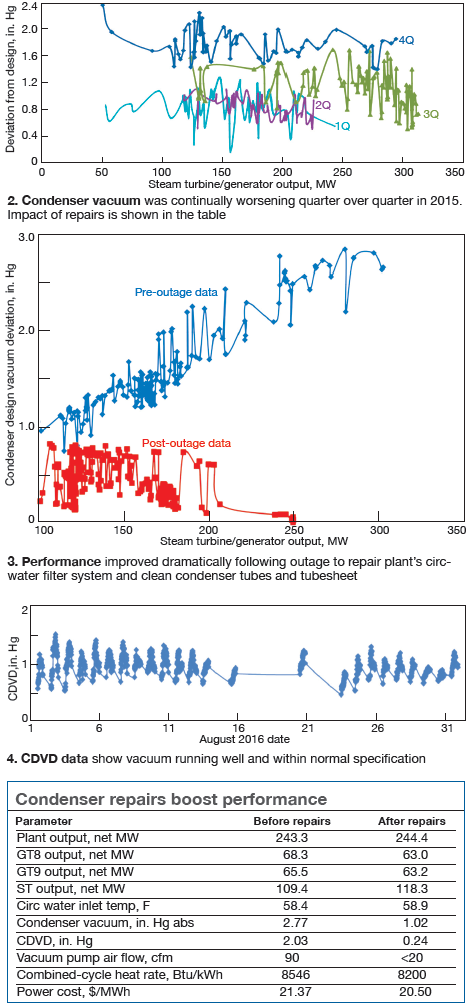
Case 1. During 2015, condenser vacuum continually deteriorated. Given the long timeframe, cycling operation, and varying CW temperatures, the deviation was suspected, but not verified. When CDVD was graphed on a quarterly basis, the movement away from design was easy to see (Fig 2). Corrective action was taken and performance improved dramatically (table).
Case 2. Prior to the fall 2016 outage, the plant’s CW filtering system failed. The decision was made to continue operating until the scheduled outage. During the outage, significant resources were expended to restore the CW filtration system to good condition, as well as to clean the condenser tubes and tubesheet. Before and after CDVD values are shown in Fig 3.
Case 3. During a summer run, operations staff thought condenser vacuum was running high. An analysis of CDVD data showed vacuum was running well within normal specification and there was no increase in CDVD (Fig 4). This precluded chasing a non-existent vacuum issue.
Case 4. Condenser performance curves also are developed by designers for operation on one CW pump. When one of two 50% CW pumps is unavailable for operation, it is typical to de-rate the plant to half load. But by using these curves and knowing nominal CDVD values, when one pump is unavailable, actual CW temperature can be used to determine available condenser duty—hence, plant output. This may mean the plant can operate at a higher capacity on the single CW pump than it otherwise might. CCJ
Project participants:
Norm Duperon, plant manager, Nueces Bay
Bill Smith, plant manager, Barney Davis
Eric Mui, senior ICE technician, Nueces Bay
Robert L Garza, operations manager, Barney Davis
Vince Powers, plant performance manager