


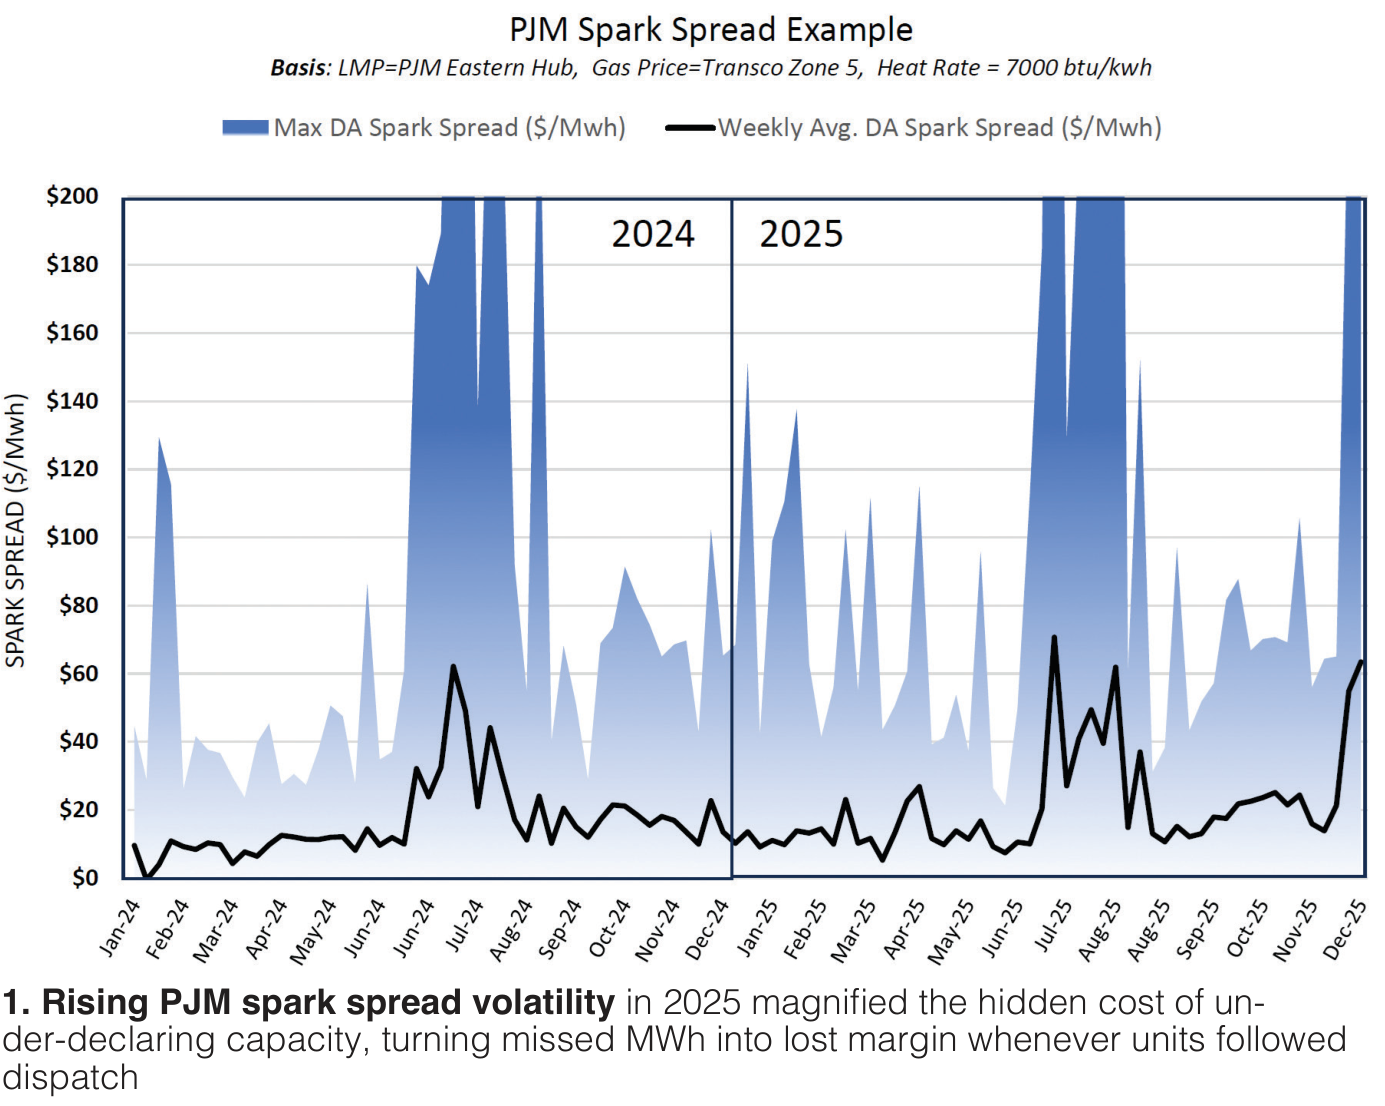
 In the current era of grid transformation, a plant’s declared capacity is no longer just a static figure in an offer sheet. It has become a dynamic driver of both margin and risk. For many combined-cycle operators, the daily ritual of capacity declaration, often handled through aging spreadsheets and “rule of thumb” adjustments, is leaking significant revenue. The challenge is that this leakage is largely invisible. While over-declaring capacity results in immediate and obvious calls from the energy desk when a unit fails to reach its setpoint, under-declaring capacity produces no such alarms. The plant simply follows dispatch, and the unrealized margin on those hidden megawatts vanishes into the ether.
The stakes are rising as ISO rules tighten and market volatility increases. In a recent webinar co-presented by Primex and Gabel Associates, “Unlocking Hidden Margin: Smarter Capacity Declarations for Volatile Power Markets,” industry experts detailed how the gap between actual capability and declared capacity is becoming more expensive. With PJM implementing more stringent follow-dispatch rules (TRLD) and energy markets showing wider spreads between day-ahead and real-time prices, the margin for error has effectively disappeared.
Value of accuracy
The financial impact of declaration error is asymmetric. Stewart Nicholson, president and founder of Primex, notes that under-declaring capacity is both more common and far more costly than over-declaring. To understand why, one must look at how these errors are settled.
When a plant over-declares, it essentially sells megawatts in the day-ahead market that it cannot deliver in real time. It must then “buy back” those megawatts at the real-time LMP. The cost (or gain) is the difference between the Day-Ahead and Real-Time (DART) price. While this can be painful during price spikes, the long-term average DART spread is often near zero. In 2024, the average DART spread in PJM was roughly 47 cents; in 2025, it actually dipped slightly negative at negative 5 cents. While the peaks are volatile, jumping from a max adverse spread of $507 in 2024 to over $1400 in 2025, the money in over-declaring that exceeds your cost is largely canceled out by the other side of the equation over a full year.
Under-declaration, however, is a pure opportunity cost. If a plant is capable of 1040 MW but only declares 1030 MW, it loses the opportunity to sell 10 MW of available capacity. In this example, the value of that lost opportunity 10 MW multiplied by the spark spread, which is the difference between the electricity price and the cost of fuel. Unlike DART spreads, spark spreads are almost always positive for an online, dispatched unit.
Recent data from the PJM Eastern Hub underscores this volatility (Fig 1). Average spark spreads for a typical CCGT increased from roughly $16/MWh in 2024 to $22/MWh in 2025. More significantly, the “top 5%” peak spreads, the hours where the most money is made, jumped from $68 to over $93. In this environment, a persistent 5-MW under-declaration error can easily translate to $500,000 in lost annual earnings for a single combined-cycle facility. The error is hidden because the plant follows dispatch perfectly, the energy desk stays quiet, and the lost margin is never quantified.
Regulatory tightening
While the financial argument for accuracy is clear, the regulatory argument is becoming equally urgent. Gabby Hudis, Vice President at Gabel Associates, highlighted upcoming changes in PJM that will change how deviations are measured and penalized.
Historically, PJM’s rules for “following dispatch” were often viewed as a series of individual snapshots. A unit might be flagged for a single interval miss, but a persistent, low-level deviation could sometimes fade into the background of the settlement process. This is changing with the introduction of Tracking Ramp Limited Desired (TRLD), a metric scheduled for full implementation in 2027.
TRLD is designed to move away from the snapshot view toward a trend view. It evaluates whether a resource is following the dispatch signal across consecutive intervals. For a plant that persistently fails to follow dispatch, perhaps because it declared a capacity it cannot physically reach, the TRLD approach ensures that the deviation remains visible and the resulting charges (Balancing Operating Reserves, or BOR) accumulate.
This metric replaces multiple older tracking mechanisms with a single, more accurate yardstick. While the de minimis thresholds for deviation stay the same, TRLD makes it much harder for a unit to condense its miss over time without actually getting closer to the dispatch signal. This isn’t unique to PJM. MISO and ERCOT have also introduced or refined “sustained deviation” rules. The goal across all RTOs is system reliability. If a unit doesn’t move as requested, the operator must rely on more expensive resources to balance the grid. By tightening the yardstick used to measure these misses, ISOs are making it increasingly expensive to operate with inaccurate declarations.
Why conventional models fail
If the cost of error is so high, why hasn’t it been solved? The answer lies in the limitations of traditional plant modeling. Most facilities rely on regression curves, often embedded in Excel sheets, that use only two variables: ambient temperature and relative humidity.
These models are static. They are typically updated once a season, if that. They fail to account for the complex interplay of factors that affect a combined cycle’s true “top of the stack” capability. Wind speed and direction (especially for plants with air-cooled condensers), duct burner performance, cooling water temperatures, and even slight degradation in gas turbine components all shift the actual capability line every hour.
Phil Friedenberg, data science lead at Primex, explains that this complexity is where machine learning provides a distinct advantage. Unlike a spreadsheet, an AI/ML model can process dozens of tags, including generator configurations, facility instrumentation data, inlet air pressure, steam cycle temperatures, and condenser backpressure, to learn how they interact. More importantly, these models self-update daily. If a plant’s performance changes due to a tuning adjustment or a component failure, the model sees the new capability in the next day’s data.
The system is also resilient to the bad data problem that often plagues automated systems. Friedenberg noted that data utilized for capacity forecasting is put through rigorous filtering. Erroneous points, such as a failed instrumentation signal or a PI point outage, are excluded. In cases of a physical malfunction, the data can be manually removed from the training set, ensuring the model doesn’t learn from an outlier event. This allows the model to perform well even in unusual weather conditions, such as the extreme cold events recently seen in the Northeast, as the system quickly learns the plant’s true capability even under those specific, rare conditions.
A case study in margin recovery
The impact of shifting to advanced data technology is best illustrated through results. In a case study of an 1100-MW PJM facility, switching from conventional regression to an ML-based system fundamentally changed the economics of the plant (Fig 2).
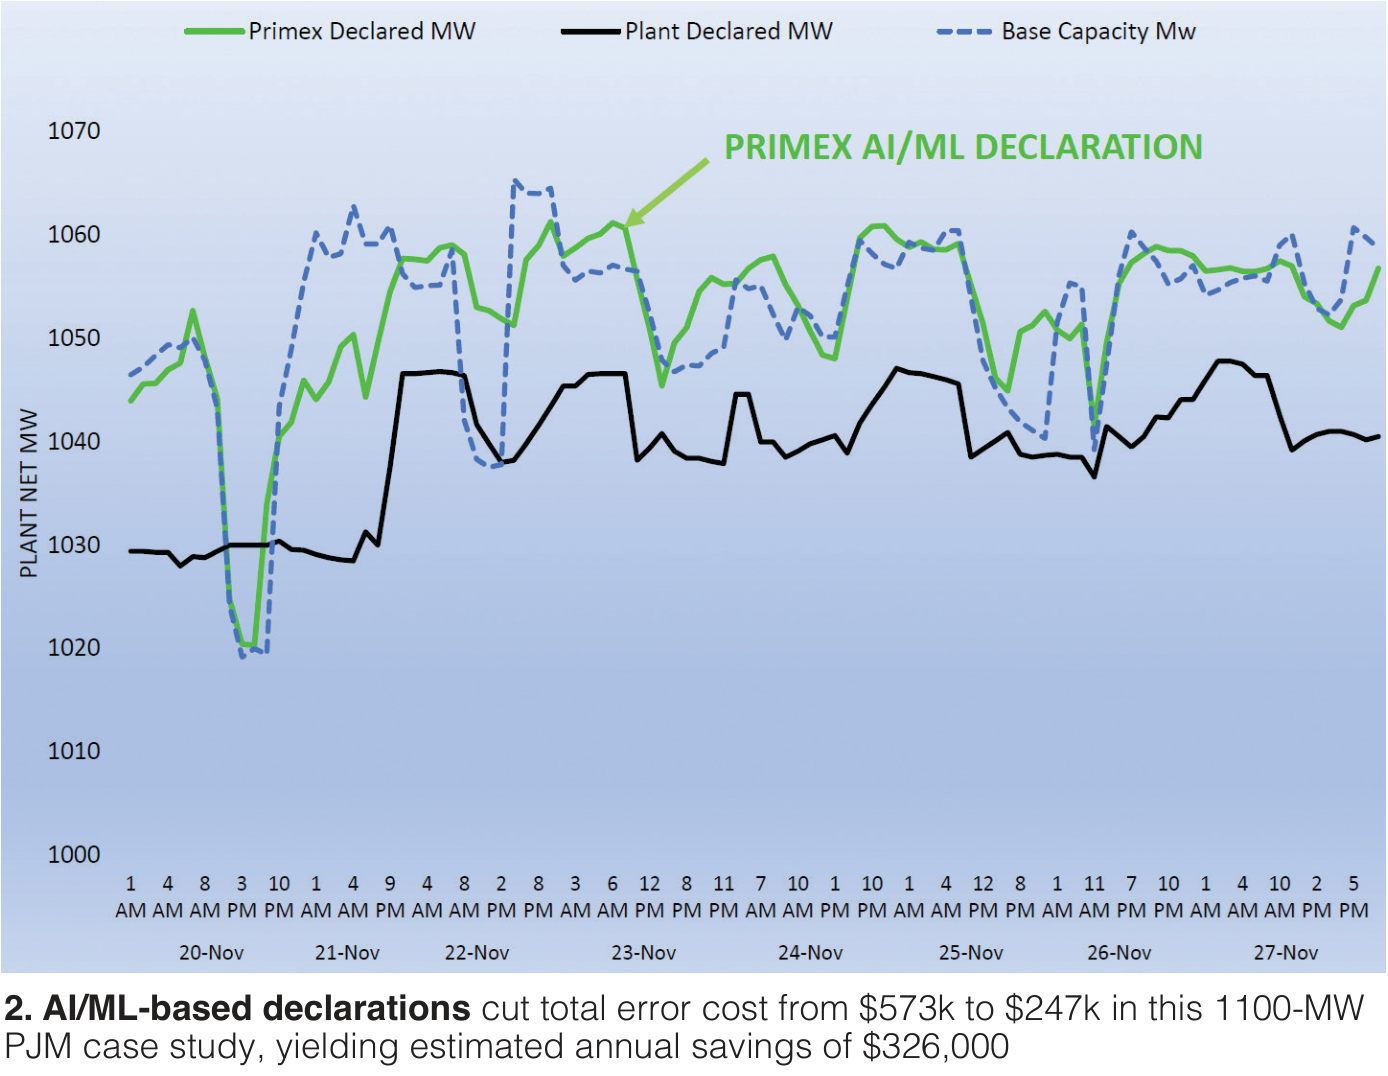
Under the conventional system, the plant experienced roughly 40,000 MWh of declaration error over a single year. This was split between 7,600 MWh of over-declaration and 33,000 MWh of under-declaration. When combined with the heat rate deficit caused by the units not operating at their most efficient baseload points, the total cost of these errors was approximately $575,000.
The ML-based system reduced this total error cost to roughly $250,000. While some error remained, primarily driven by weather forecast inaccuracies, which are unavoidable, the more accurate declaration captured an additional $325,000 in margin.
This isn’t just about combined cycles. The technology is already being applied to other asset classes. Friedenberg mentioned that similar models are now forecasting hydro capacity up to 90 days out, providing better data for maintenance decisions and long-term operating outlooks.
Moving beyond the “correction bias”
Overcoming the declaration gap requires a change in operational culture as much as it requires new software. At many plants, an over-declaration is treated as a failure because it results in a call from the energy desk. This creates a natural “correction bias” where operators shave a few megawatts off the forecast to ensure they have a comfortable buffer.
This buffer is the hidden margin. It’s the capacity the plant has but cannot predict reliably using conventional methods.
The first step for any asset manager is to quantify the current error. This means looking back at historical data to see how often the plant was “railed” at its declared max while its internal parameters suggested more was available. This validation process, which involves comparing actual production against the previous day’s declaration, is the only way to make the invisible visible.
The second step is staying ahead of the regulatory curve. Preparing for 2027 means running a current view of dispatch following performance and BOR charge exposure now.
Finally, for many, the most direct path is a pilot program. Testing an AI/ML declaration system on a single facility for three to six months allows an owner to understand the specific upside for their fleet. As power markets become more volatile and ISOs become more demanding, the ability to accurately declare what a plant can do is shifting from a back-office administrative task to a front-line competitive advantage. The megawatts are there; the challenge is making sure they all get to market every day. CCJ